Place & COVID-19 Mortality
Five studies estimating how air pollution, urban form, and human mobility shaped pandemic mortality, across 231 countries, 46 cities, and 57,185 United States neighborhoods.
Research question
Which places lost more people, and why?
Early pandemic research associated air pollution with COVID-19 outcomes using national case counts and single-city designs. Two properties of that evidence limit what it supports. Recorded COVID-19 deaths depend on testing capacity and certification practice, which differed between countries and changed through 2020, so the outcome is not comparable across the places being compared. And a single coefficient estimated over a country conceals the variation between cities, which is the scale at which policy is written and at which exposure is actually experienced.
The five studies collected here address both. Exposure and outcome are estimated at the scale at which they vary, first across 231 countries and then city by city across forty-six cities. The outcome is re-derived as excess all-cause mortality against a pre-pandemic benchmark rather than accepted as a recorded count. And the exposure itself is explained: the change in NO2 under lockdown is traced to the configuration of urban function, and the collapse in urban space usage is traced to the built environment across 459 United States cities.
Approach
Three moves across five studies
Estimate at the scale of variation
Generalized additive models capture non-linear associations at global scale. Bayesian space-time hierarchical models then estimate city-specific relative risks at lags of seven, fourteen, and twenty-one days, controlling for meteorology and mobility.
Re-derive the outcome
A SARIMA model fitted to 2015 through 2019 mortality supplies a weekly benchmark for what would have been expected. Excess all-cause mortality is the departure from that benchmark, and is comparable where recorded COVID-19 deaths are not.
Explain the exposure
SARIMAX with dynamic time warping quantifies NO2 variation under emission restriction; landscape fragmentation indices describe urban configuration; geographically weighted regression relates the built environment to mobility at two spatial scales.
Theme 1
Establishing the association at the right scale
Both studies below estimate the air pollution and COVID-19 relationship, and both find that a single pooled coefficient misrepresents it. The first takes the city as the unit of inference, the second the country.
Annals of the American Association of Geographers · 2022 · first author
City-specific relative risks in a Bayesian space-time model
Meng, Y., Wong, M. S., Kwan, M.-P., & Zhu, R. (2022). Association between global air pollution and COVID-19 mortality: a study of forty-six cities in the world. Annals of the American Association of Geographers, 1–17.
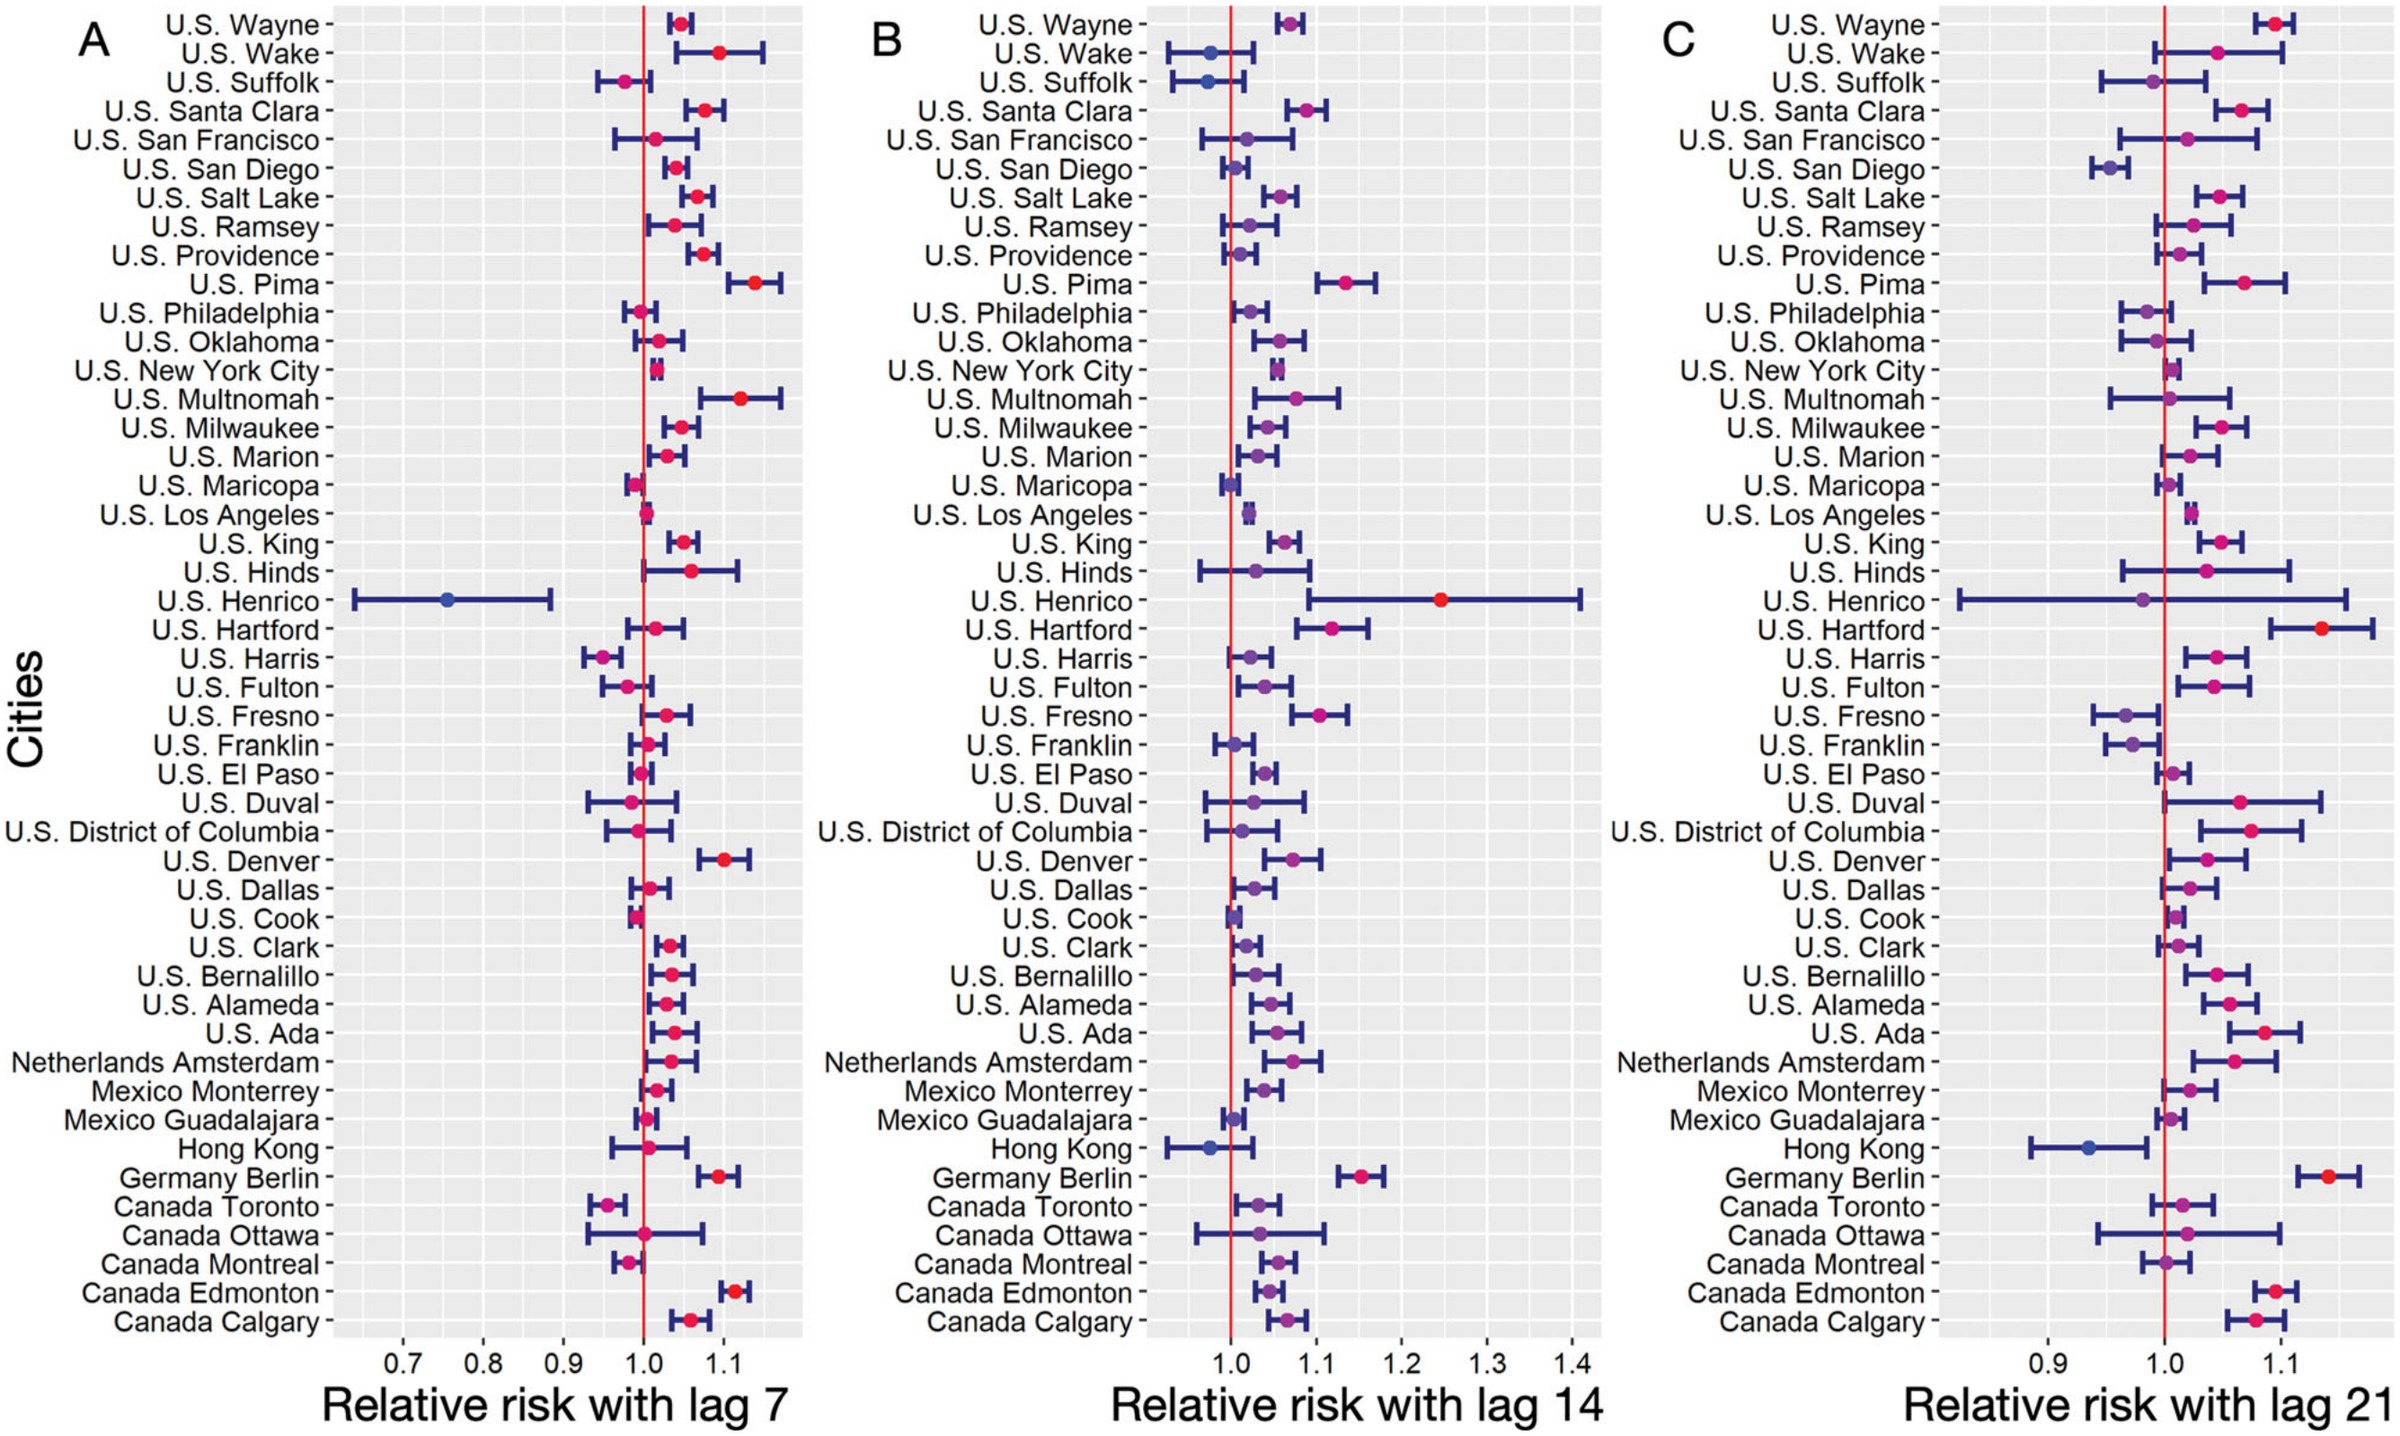
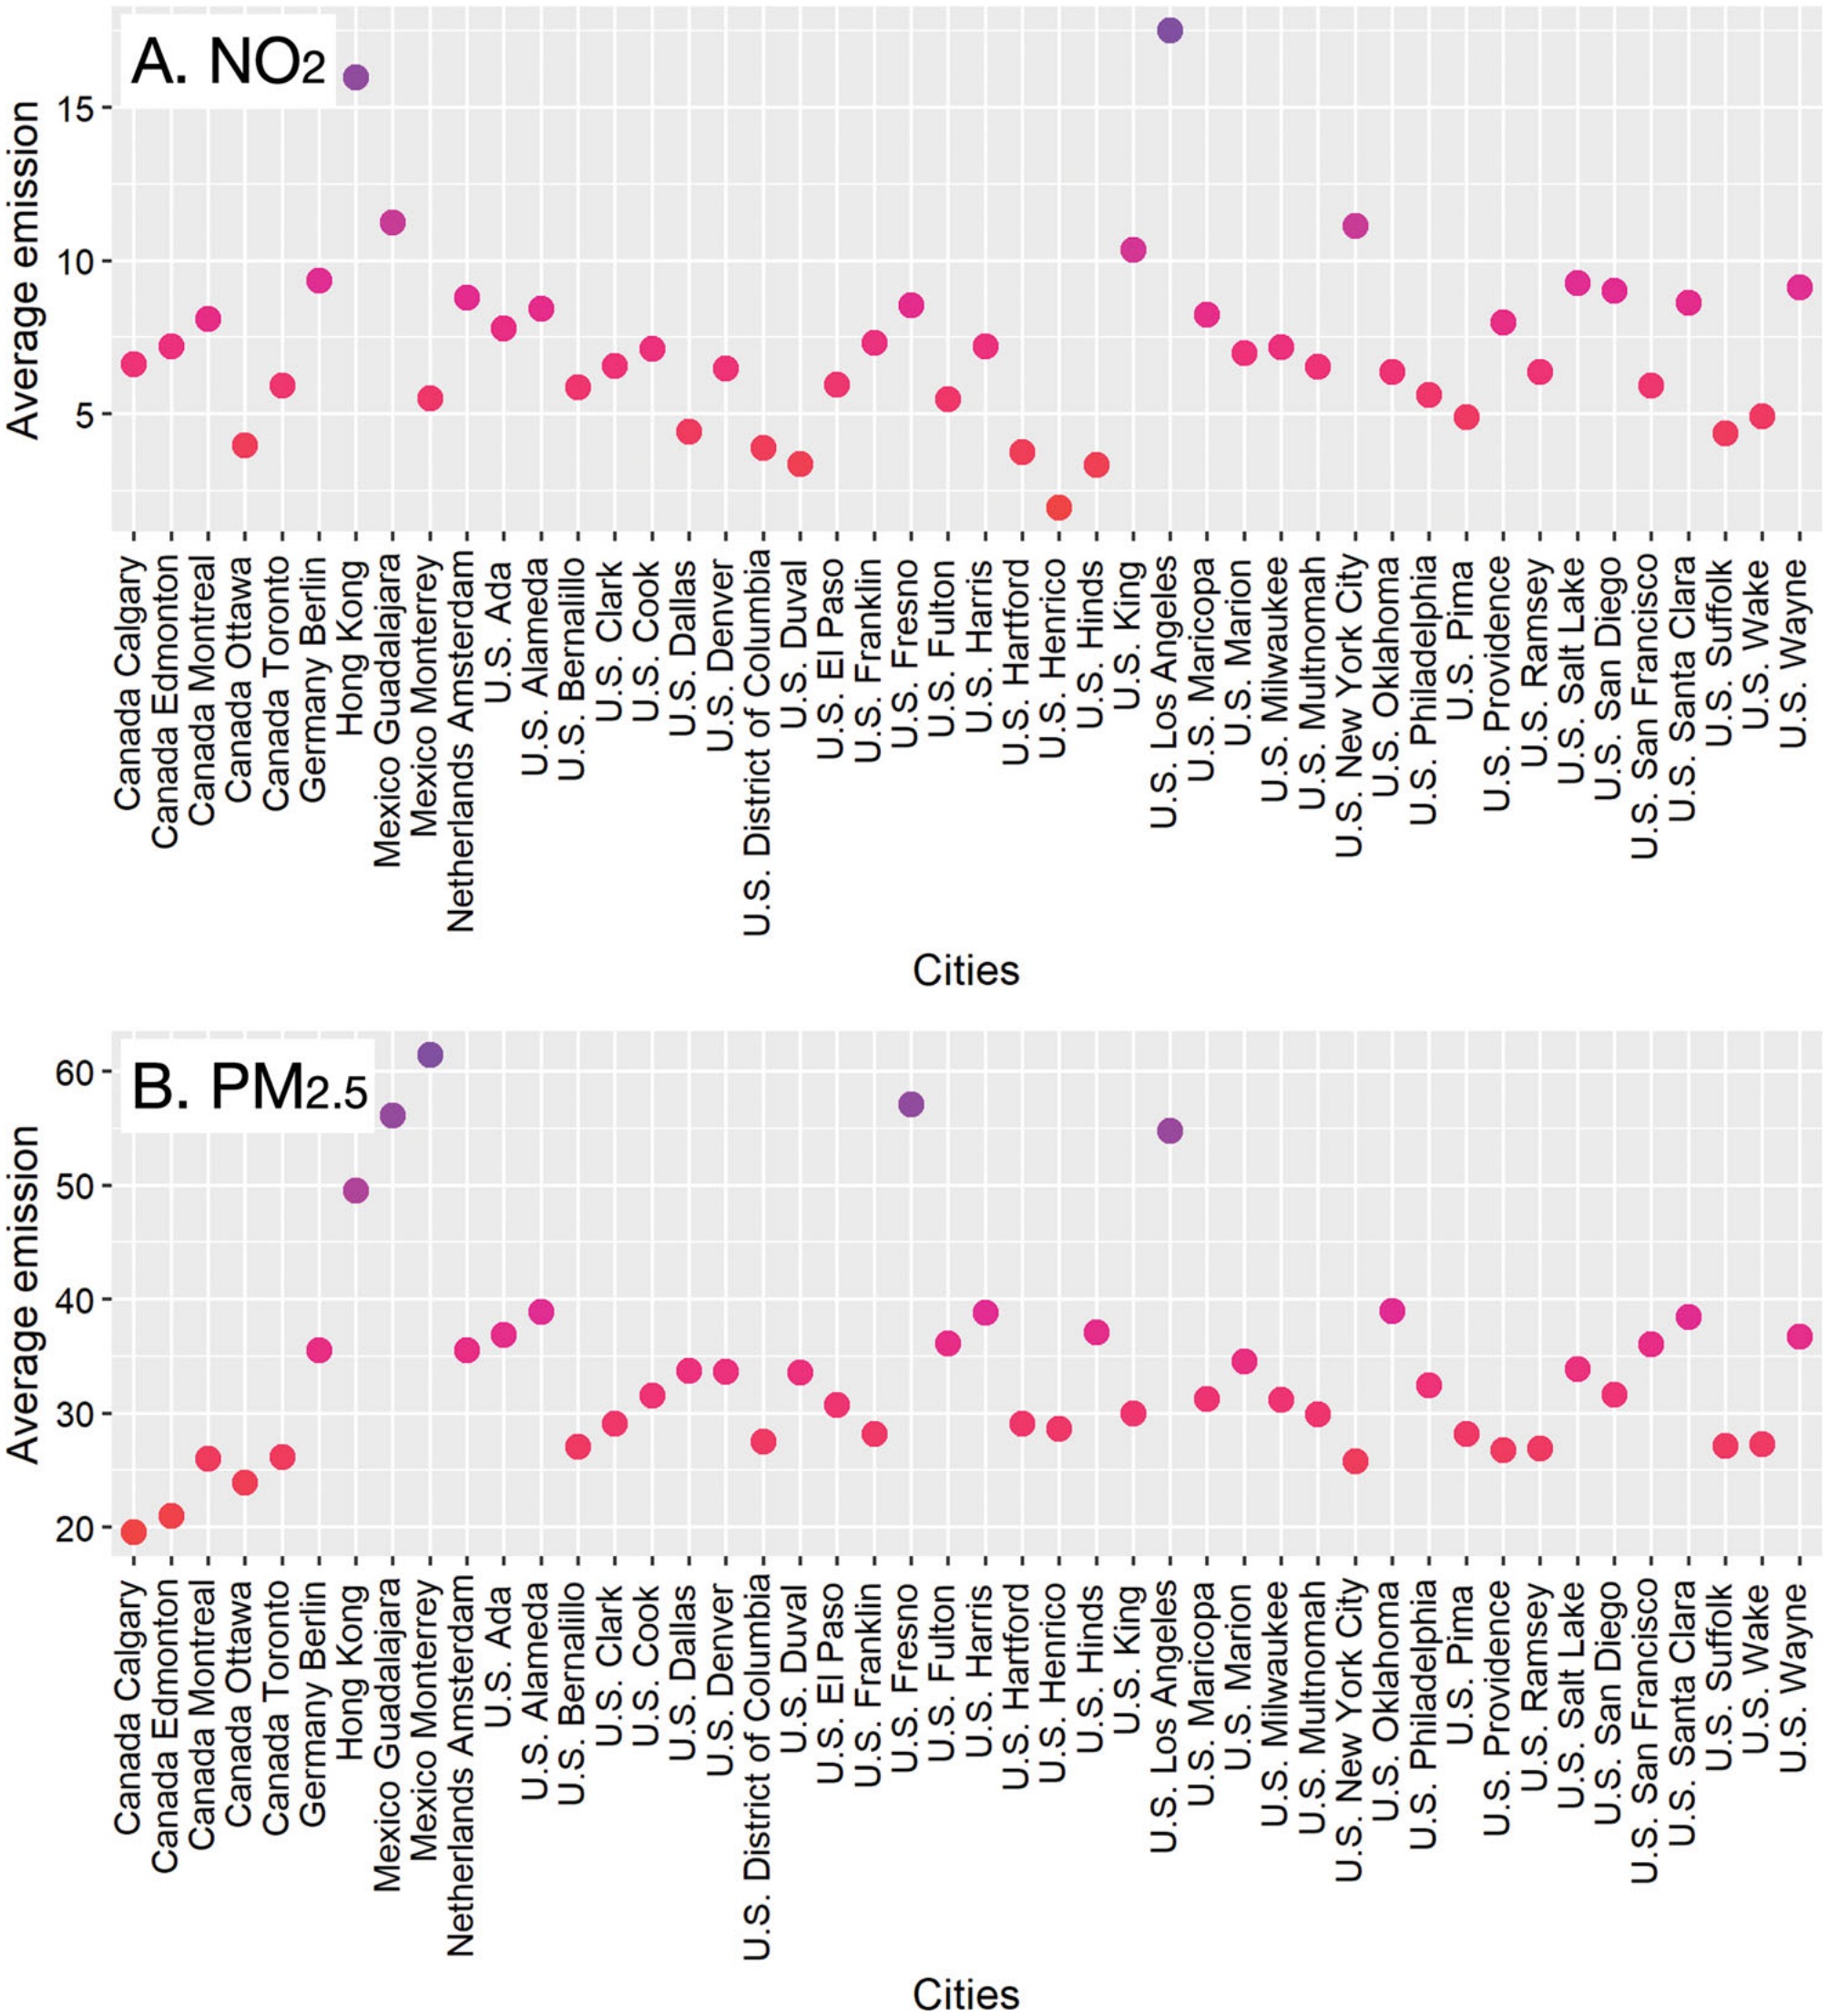
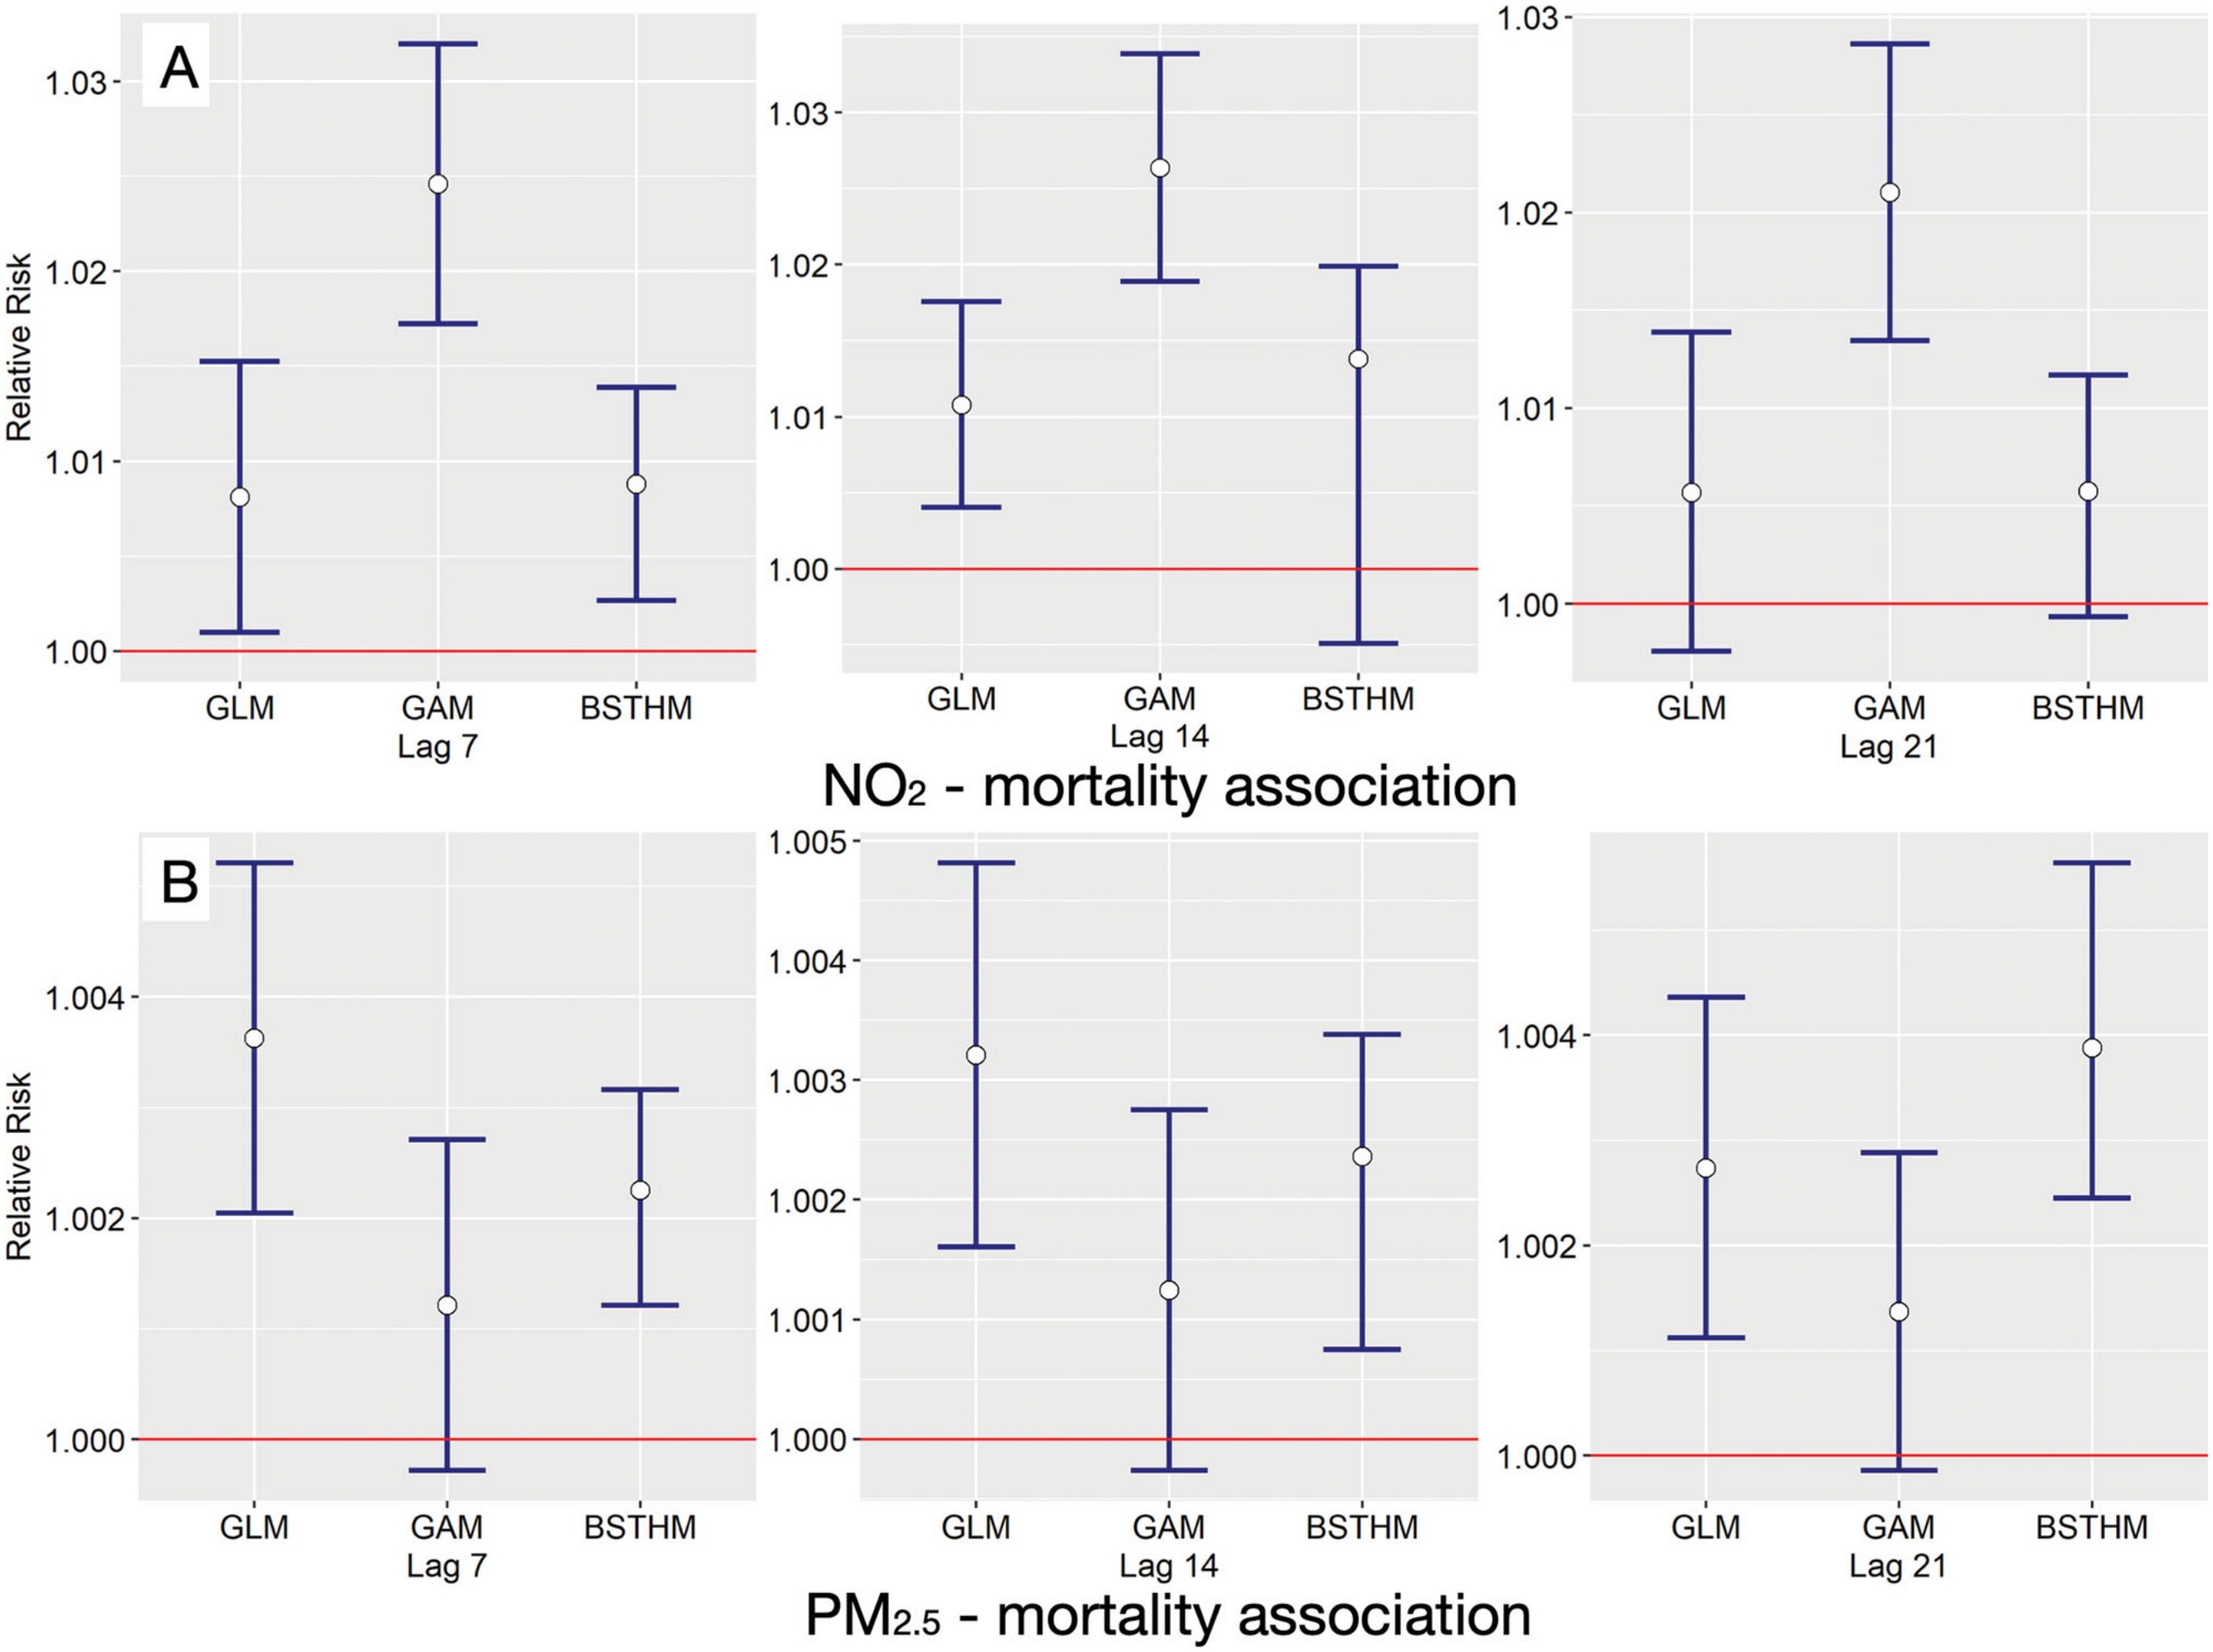
Forty-six cities across six countries, between 1 April and 31 December 2020, were analyzed with a Bayesian space-time hierarchical model at lags of seven, fourteen, and twenty-one days, accounting for meteorological variability and human mobility at both global and city level. Pooled across all cities, the relative risks were 1.006 to 1.014 for NO2 and 1.002 to 1.004 for PM2.5: small, positive, and consistent with the published literature.
Estimated city by city, the same data give relative risks from 0.754 to 1.245 for NO2 and from 0.888 to 1.032 for PM2.5. Both positive and negative associations appear among the forty-six. The pooled figure is therefore an average taken over cities whose exposure and mortality relationships differ in sign, and reporting it alone would describe none of them. This is the argument for treating the city, rather than the country, as the unit of inference.
ISPRS International Journal of Geo-Information · 2021 · first author
Non-linear associations between global air pollution and early COVID-19 incidence
Meng, Y., Wong, M. S., Xing, H., Kwan, M.-P., & Zhu, R. (2021). Yearly and daily relationship assessment between air pollution and early-stage COVID-19 incidence: evidence from 231 countries and regions. ISPRS International Journal of Geo-Information, 10(6), 401.
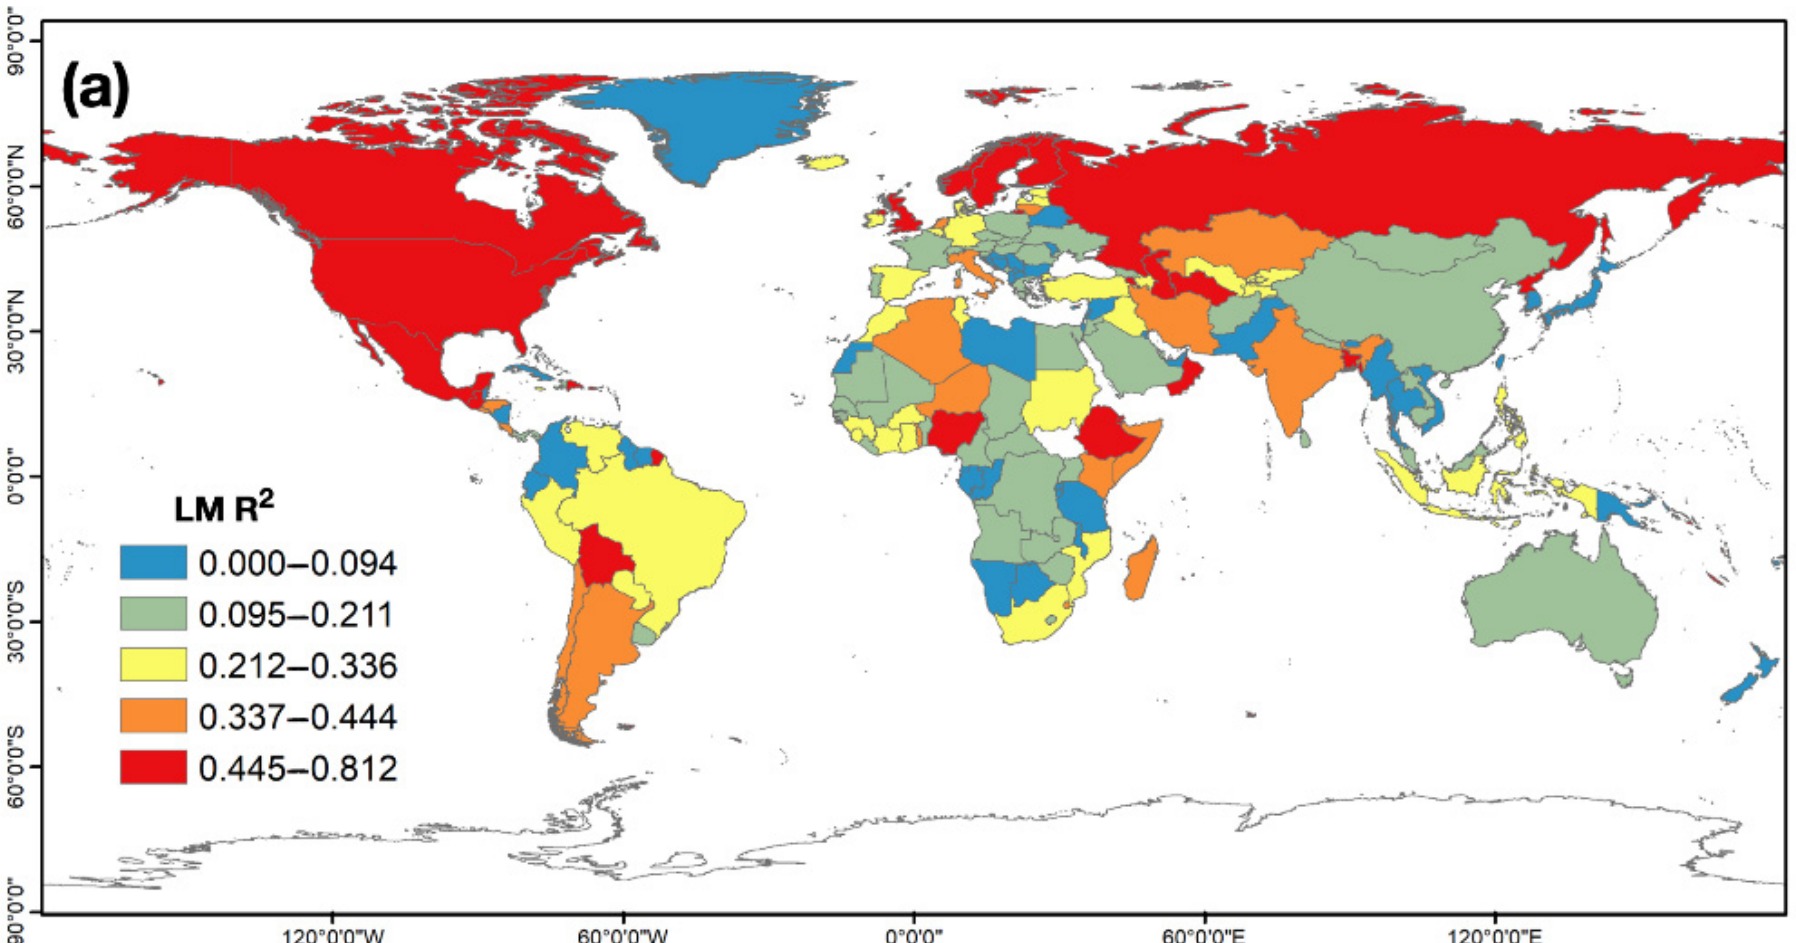
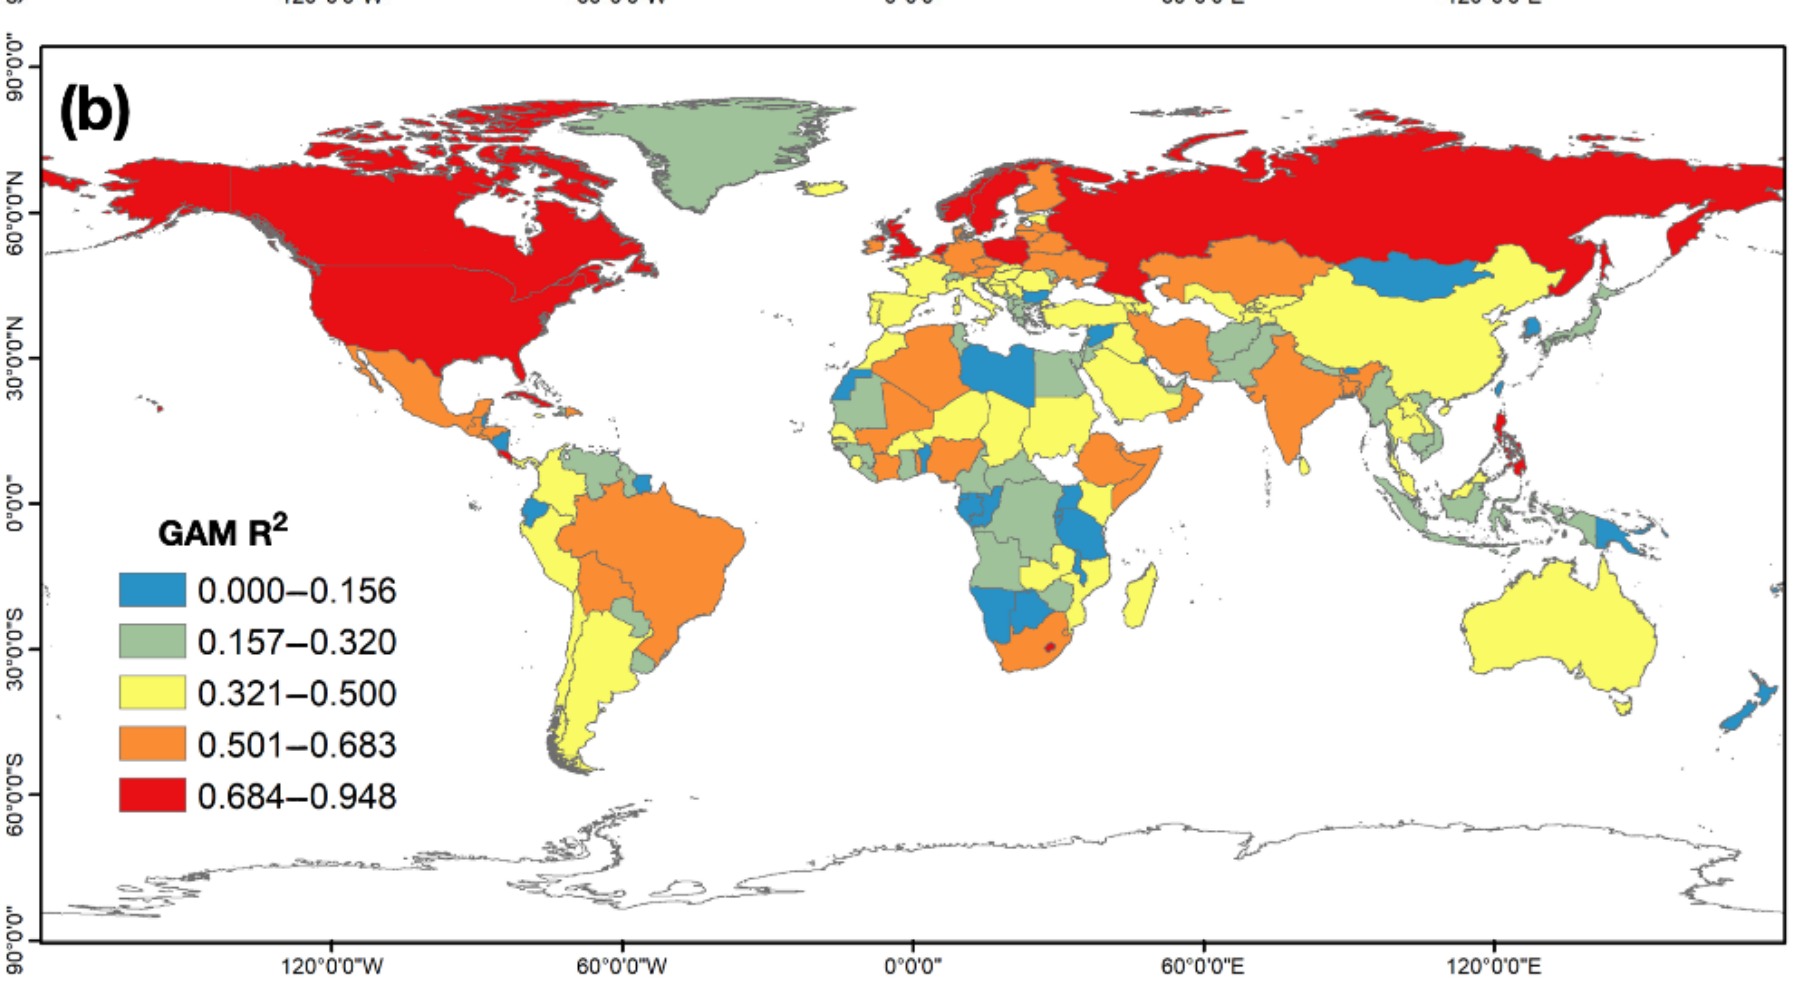
Tropospheric CO, NO2, O3, and SO2 concentrations were assembled with daily confirmed cases between 23 January and 31 May 2020, and generalized additive models estimated non-linear associations for both the yearly discrepancy in pollution and its daily concentration. The associations proved spatially and temporally non-stationary. Yearly increases in CO, O3, and SO2 accompanied rising case numbers, and NO2 discrepancy produced a pronounced peak. In the daily assessment, CO and SO2 were positively associated with confirmed cases while NO2 was negatively associated, the opposite sign to its yearly result. A single global linear coefficient would report neither pattern.
Theme 2
Getting the outcome right
International Journal of Environmental Research and Public Health · 2021 · first author
Excess all-cause mortality against a pre-pandemic benchmark
Meng, Y., Wong, M. S., Xing, H., Kwan, M.-P., & Zhu, R. (2021). Assessing the country-level excess all-cause mortality and the impacts of air pollution and human activity during the COVID-19 epidemic. International Journal of Environmental Research and Public Health, 18(13), 6883.
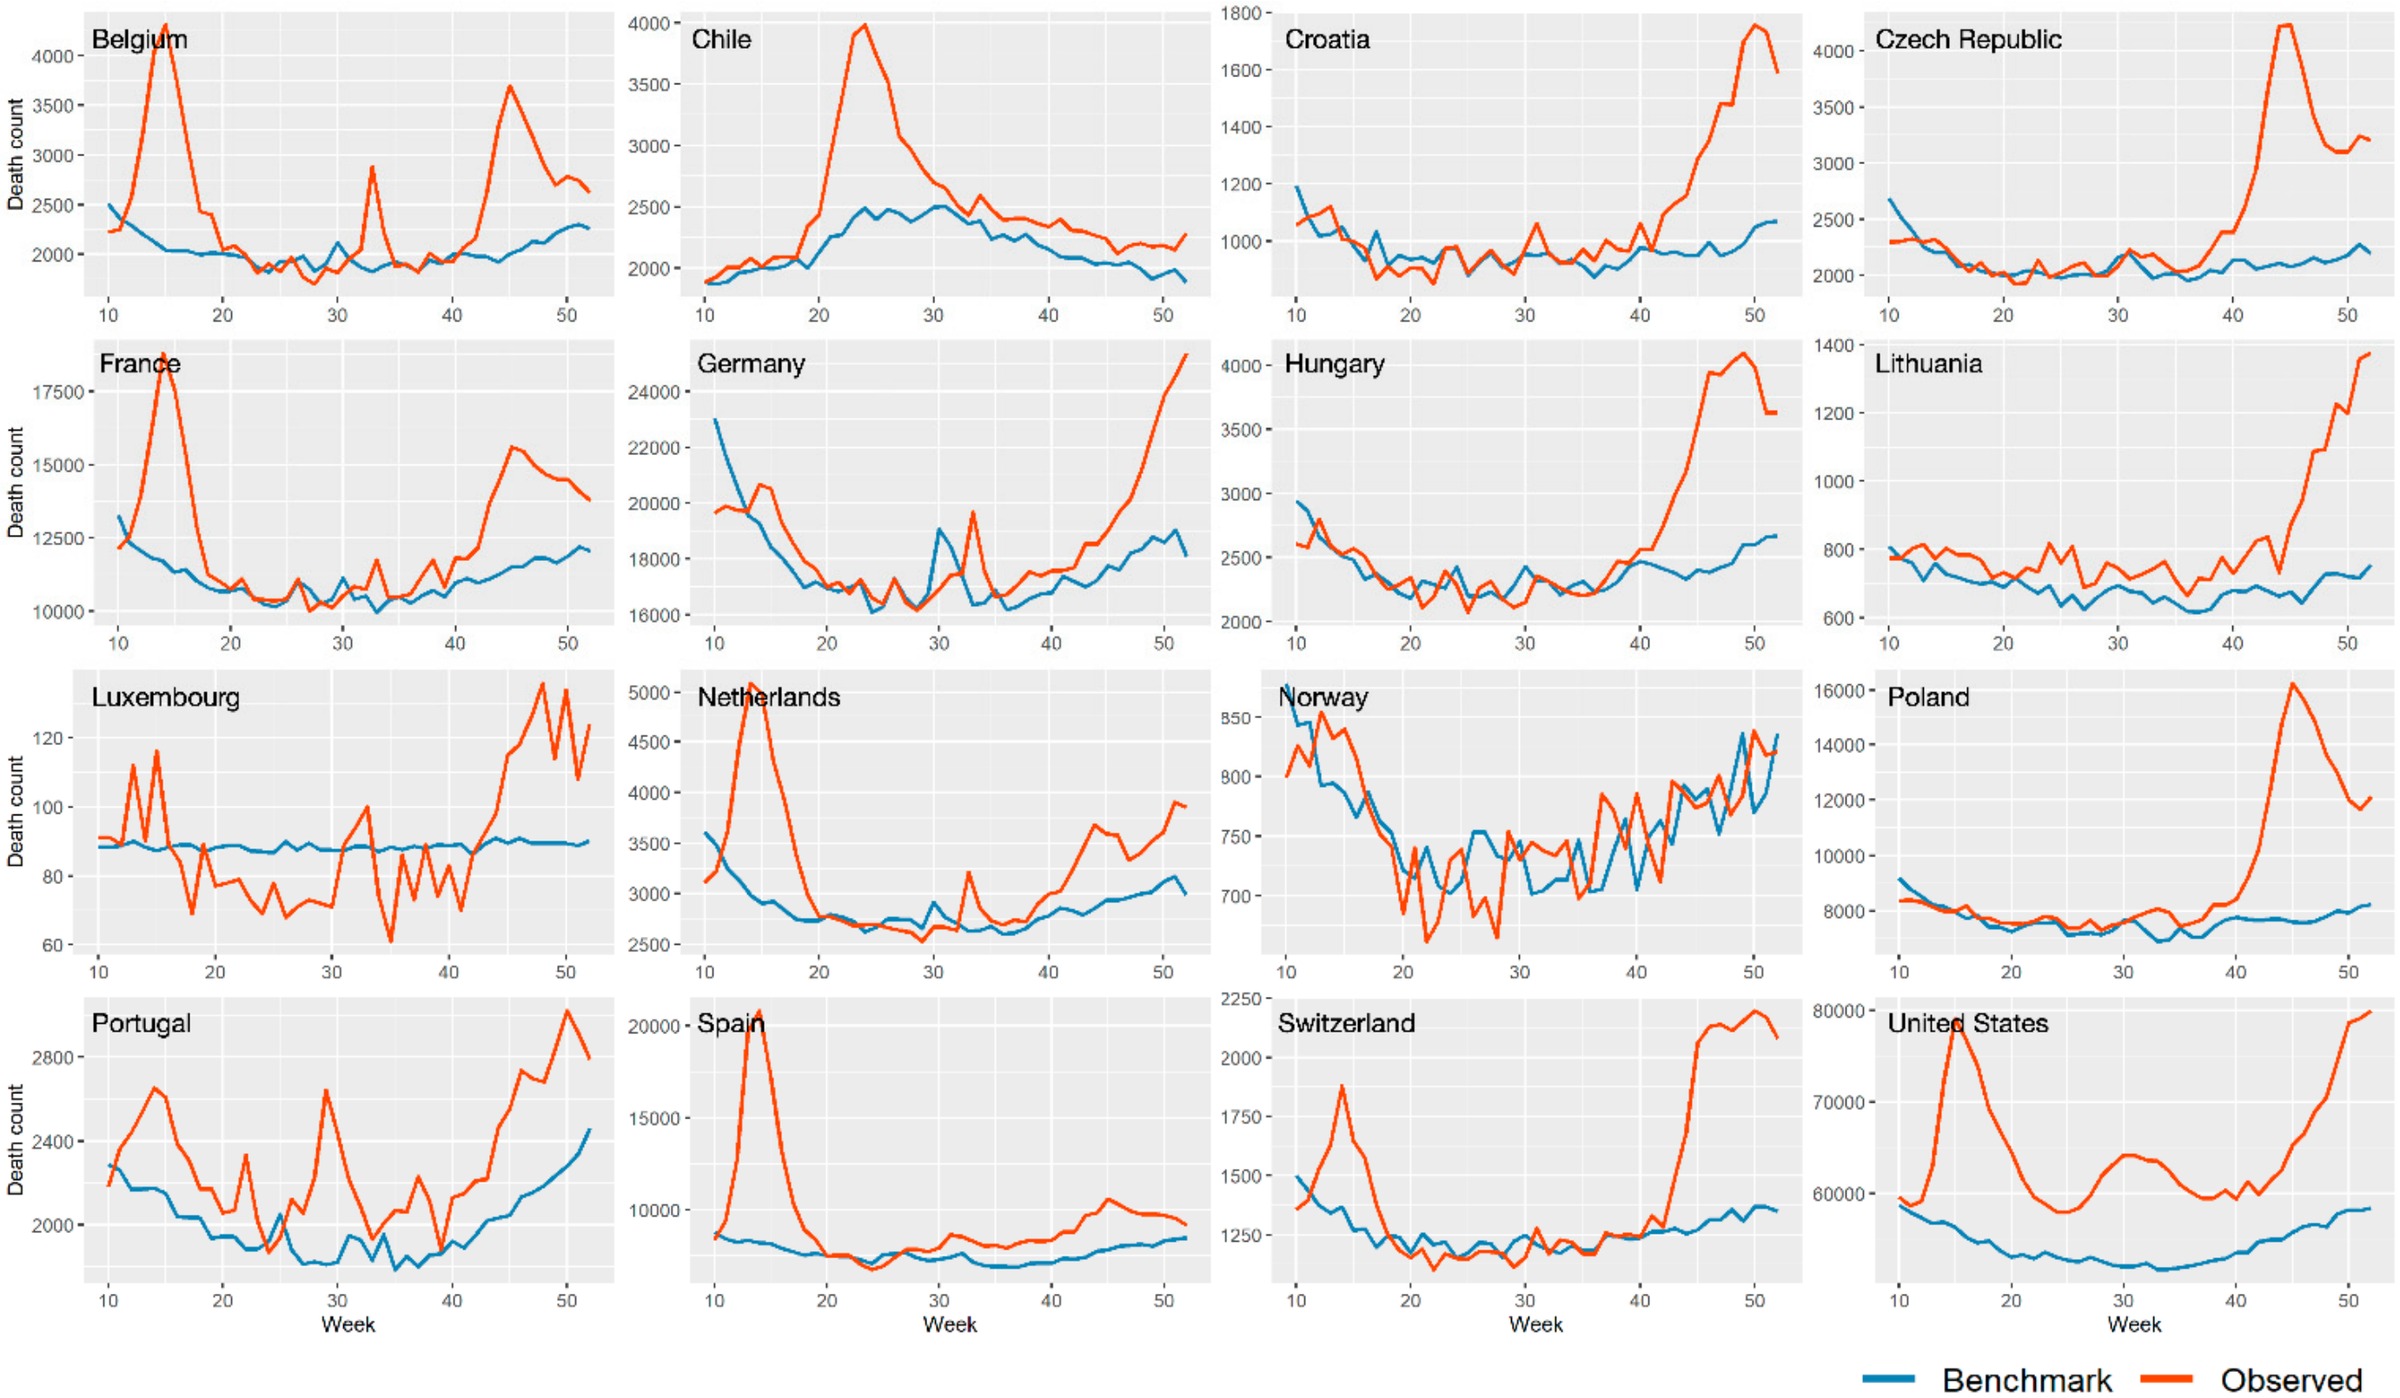
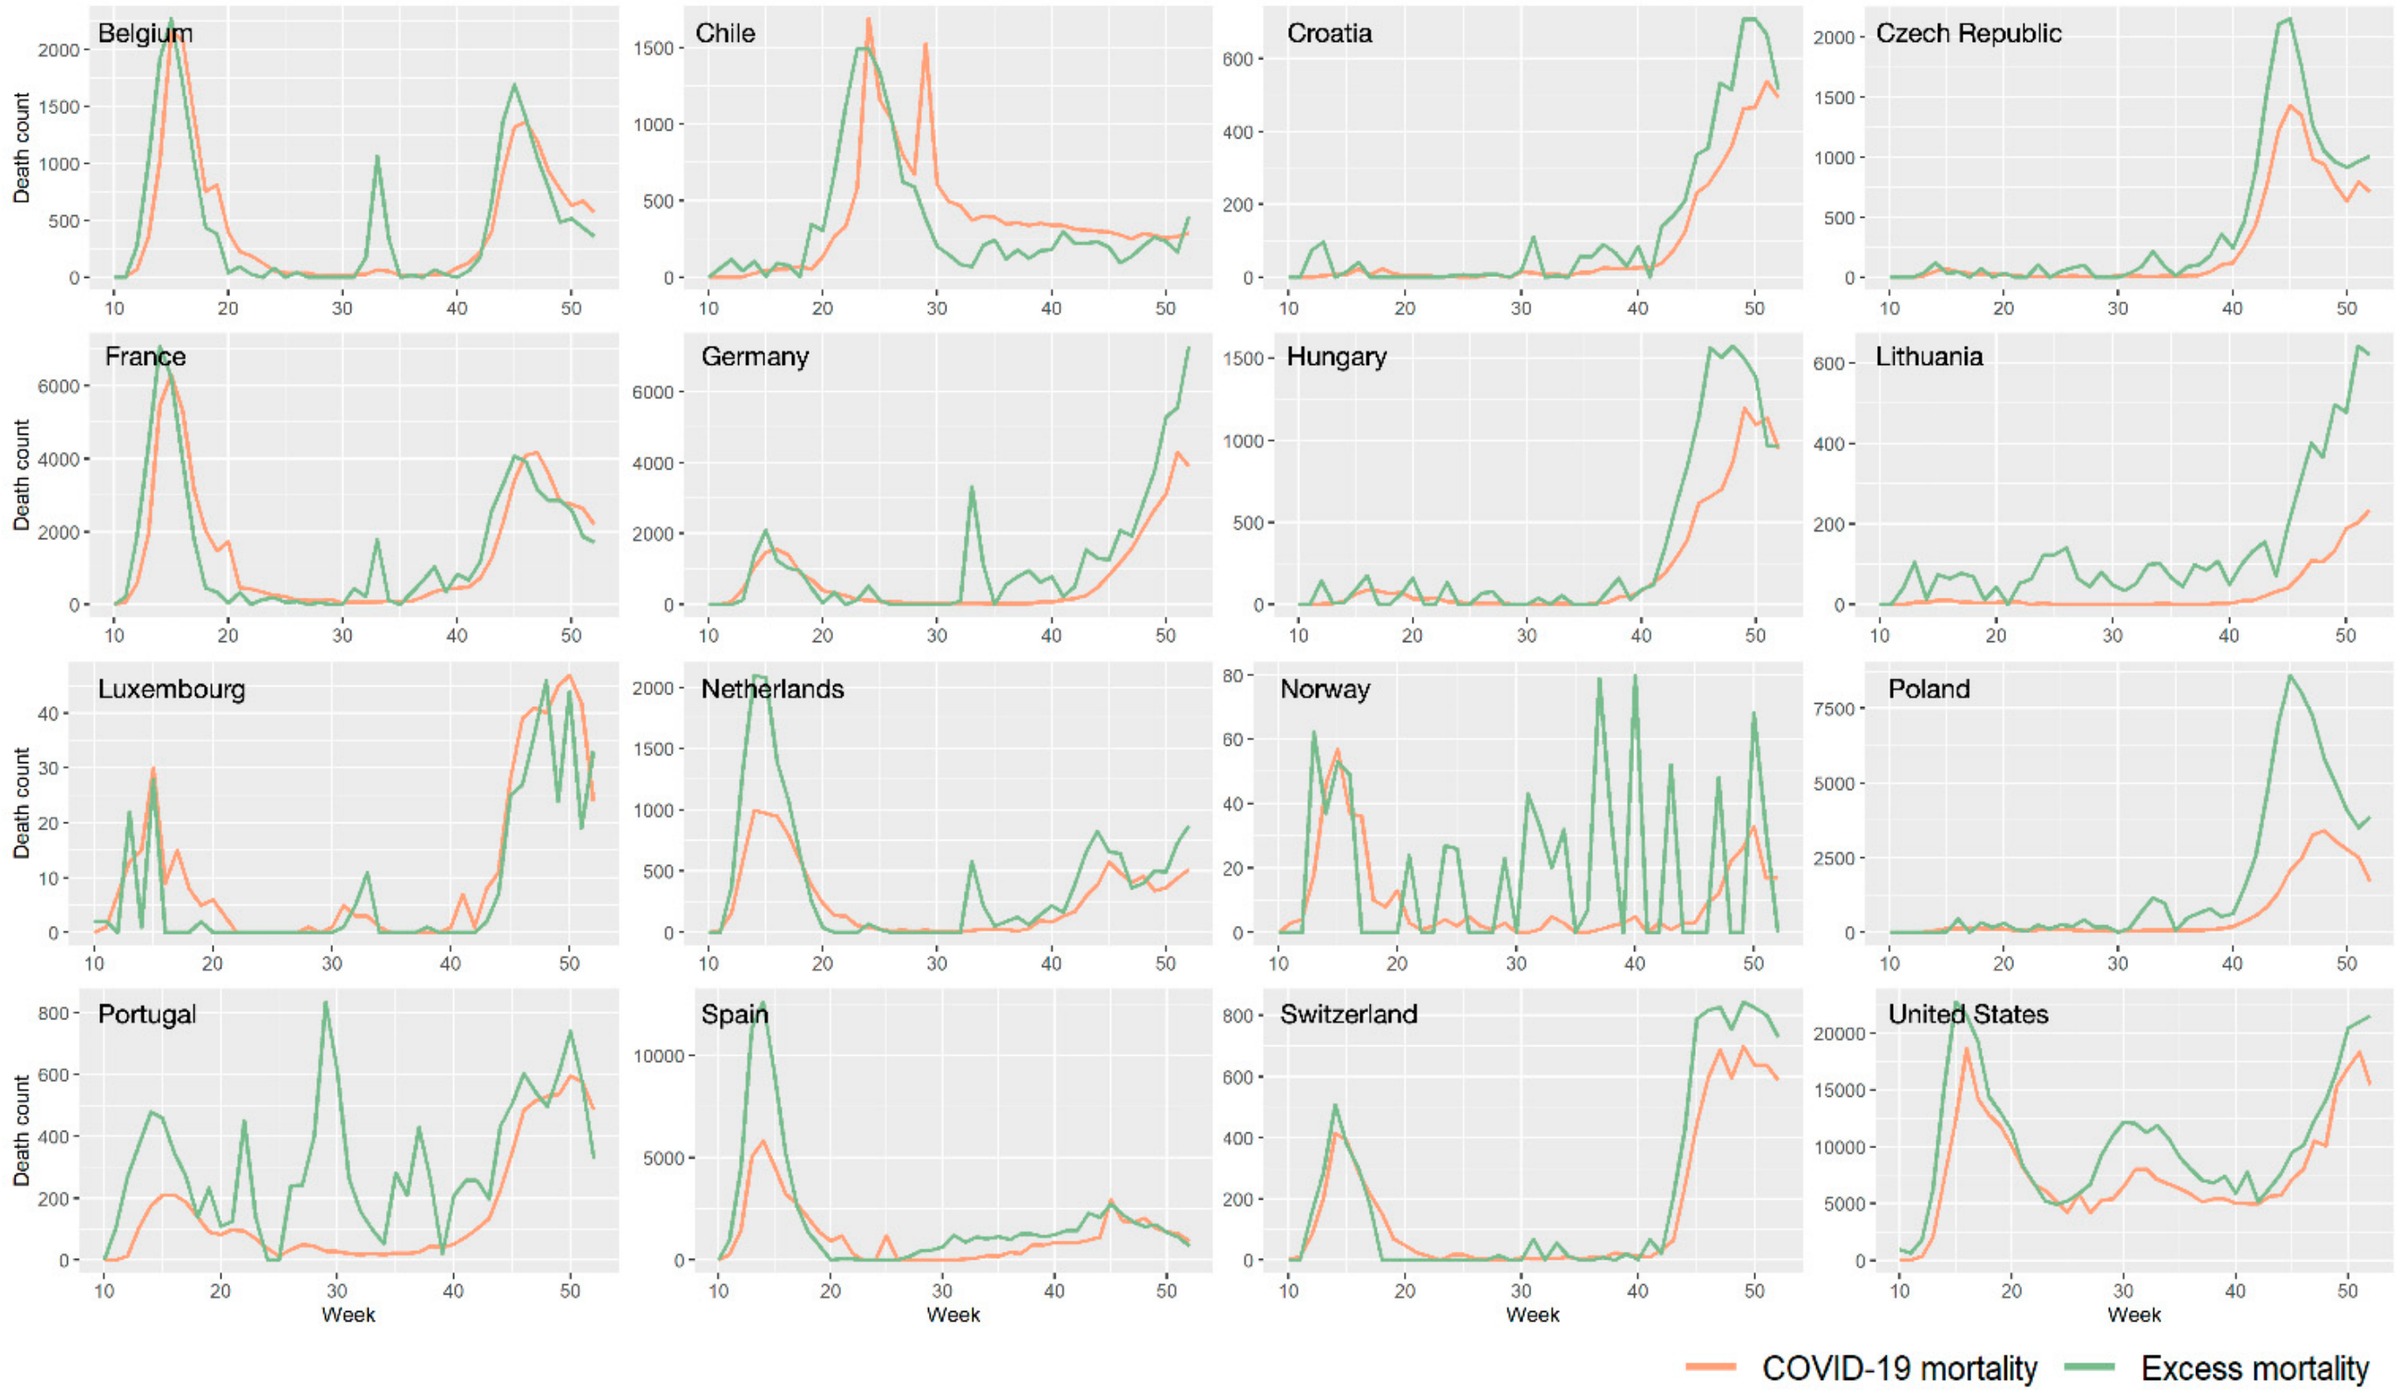
A SARIMA model fitted to 2015 through 2019 mortality produced a weekly benchmark for sixteen countries, and excess all-cause mortality was calculated as the departure from that benchmark across weeks 10 to 52 of 2020. Excess mortality ranged from −26.52 percent to 373.60 percent and exceeded recorded COVID-19 mortality in most of the sixteen. A quasi-likelihood Poisson generalized additive model then related it to ground-level NO2 and PM2.5 and to the frequency of park and workplace visits. A one-unit weekly increase was associated with a 1.54 percent increase in excess mortality for NO2, and decreases of 0.19, 0.23, and 0.23 percent for PM2.5, park visits, and workplace visits. Estimated instead on recorded COVID-19 deaths, the air pollution risks were higher and the mobility risks lower. The choice of outcome therefore moves the exposure estimate itself, not only its precision.
Theme 3
Why exposure varied from place to place
The first two themes estimate associations. The two studies below ask what produced the exposure in the first place, using the pandemic restrictions as a natural experiment on emission and on movement.
Scientific Reports · 2021 · first author
Urban functional fragmentation and NO2 under emission restriction
Meng, Y., Wong, M. S., Xing, H., Zhu, R., Qin, K., Kwan, M.-P., Lee, K. H., Kwok, C. Y. T., & Li, H. (2021). Effects of urban functional fragmentation on nitrogen dioxide (NO2) variation with anthropogenic-emission restriction in China. Scientific Reports, 11, 11908.
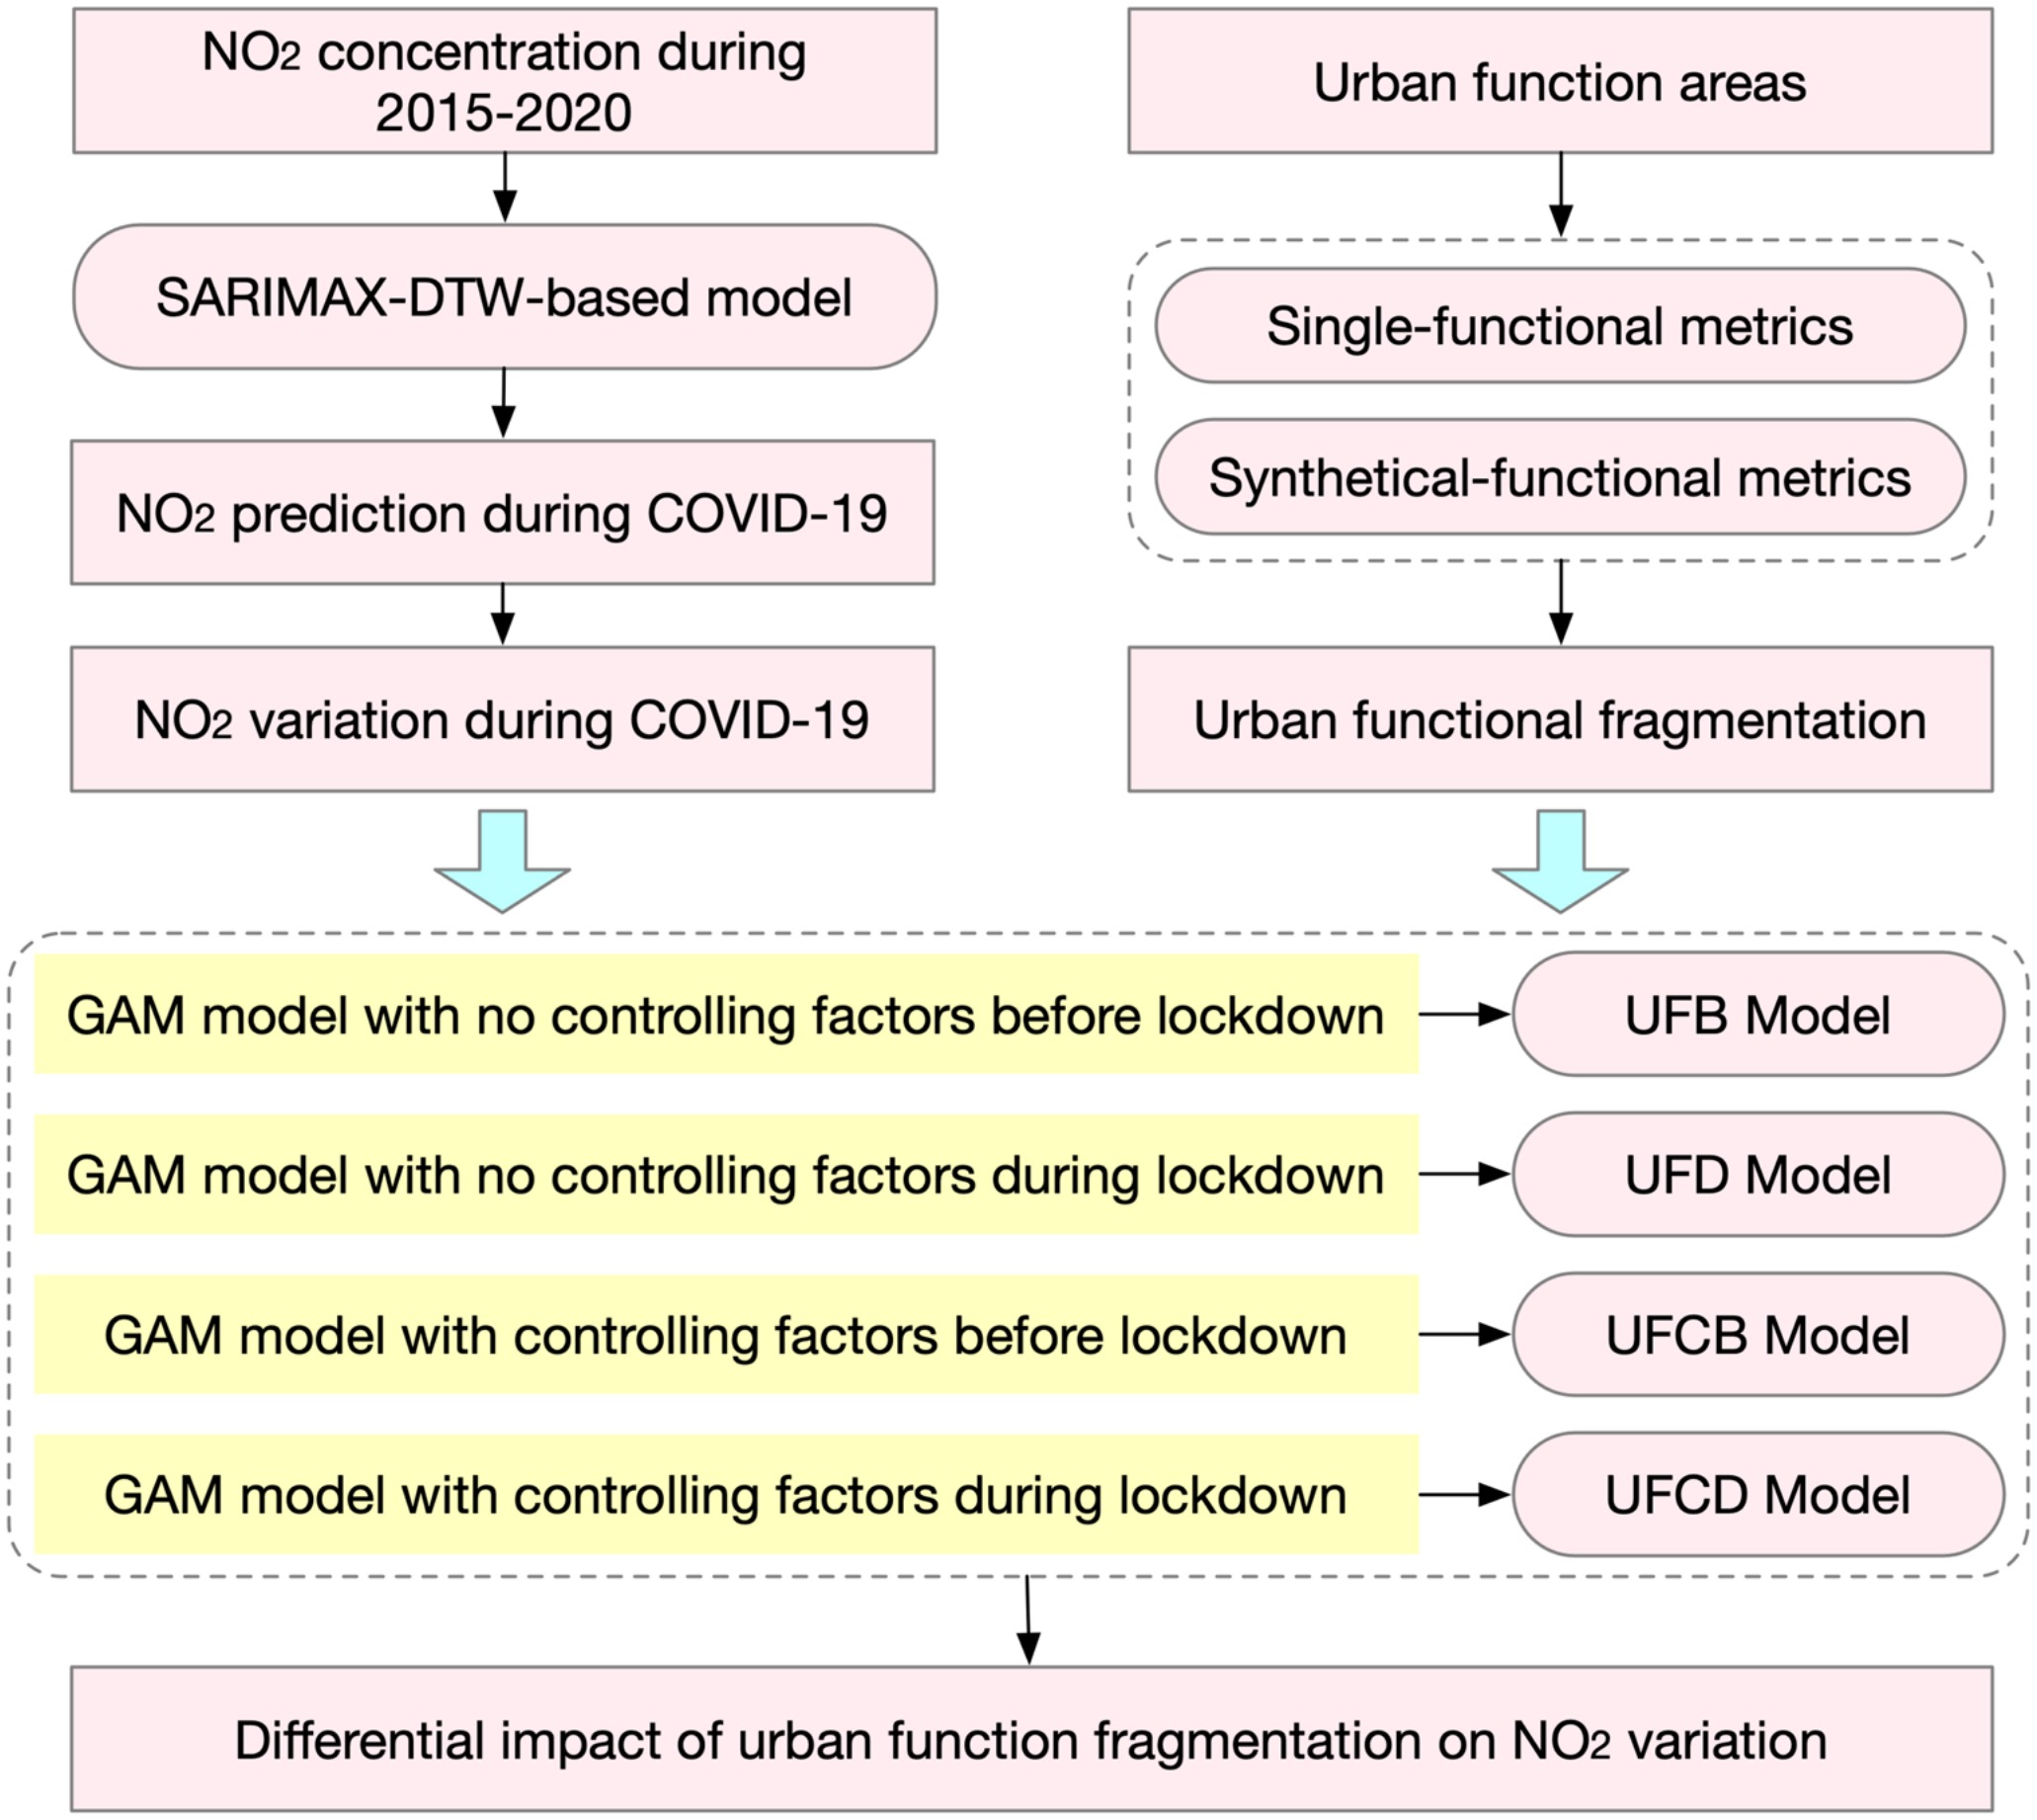
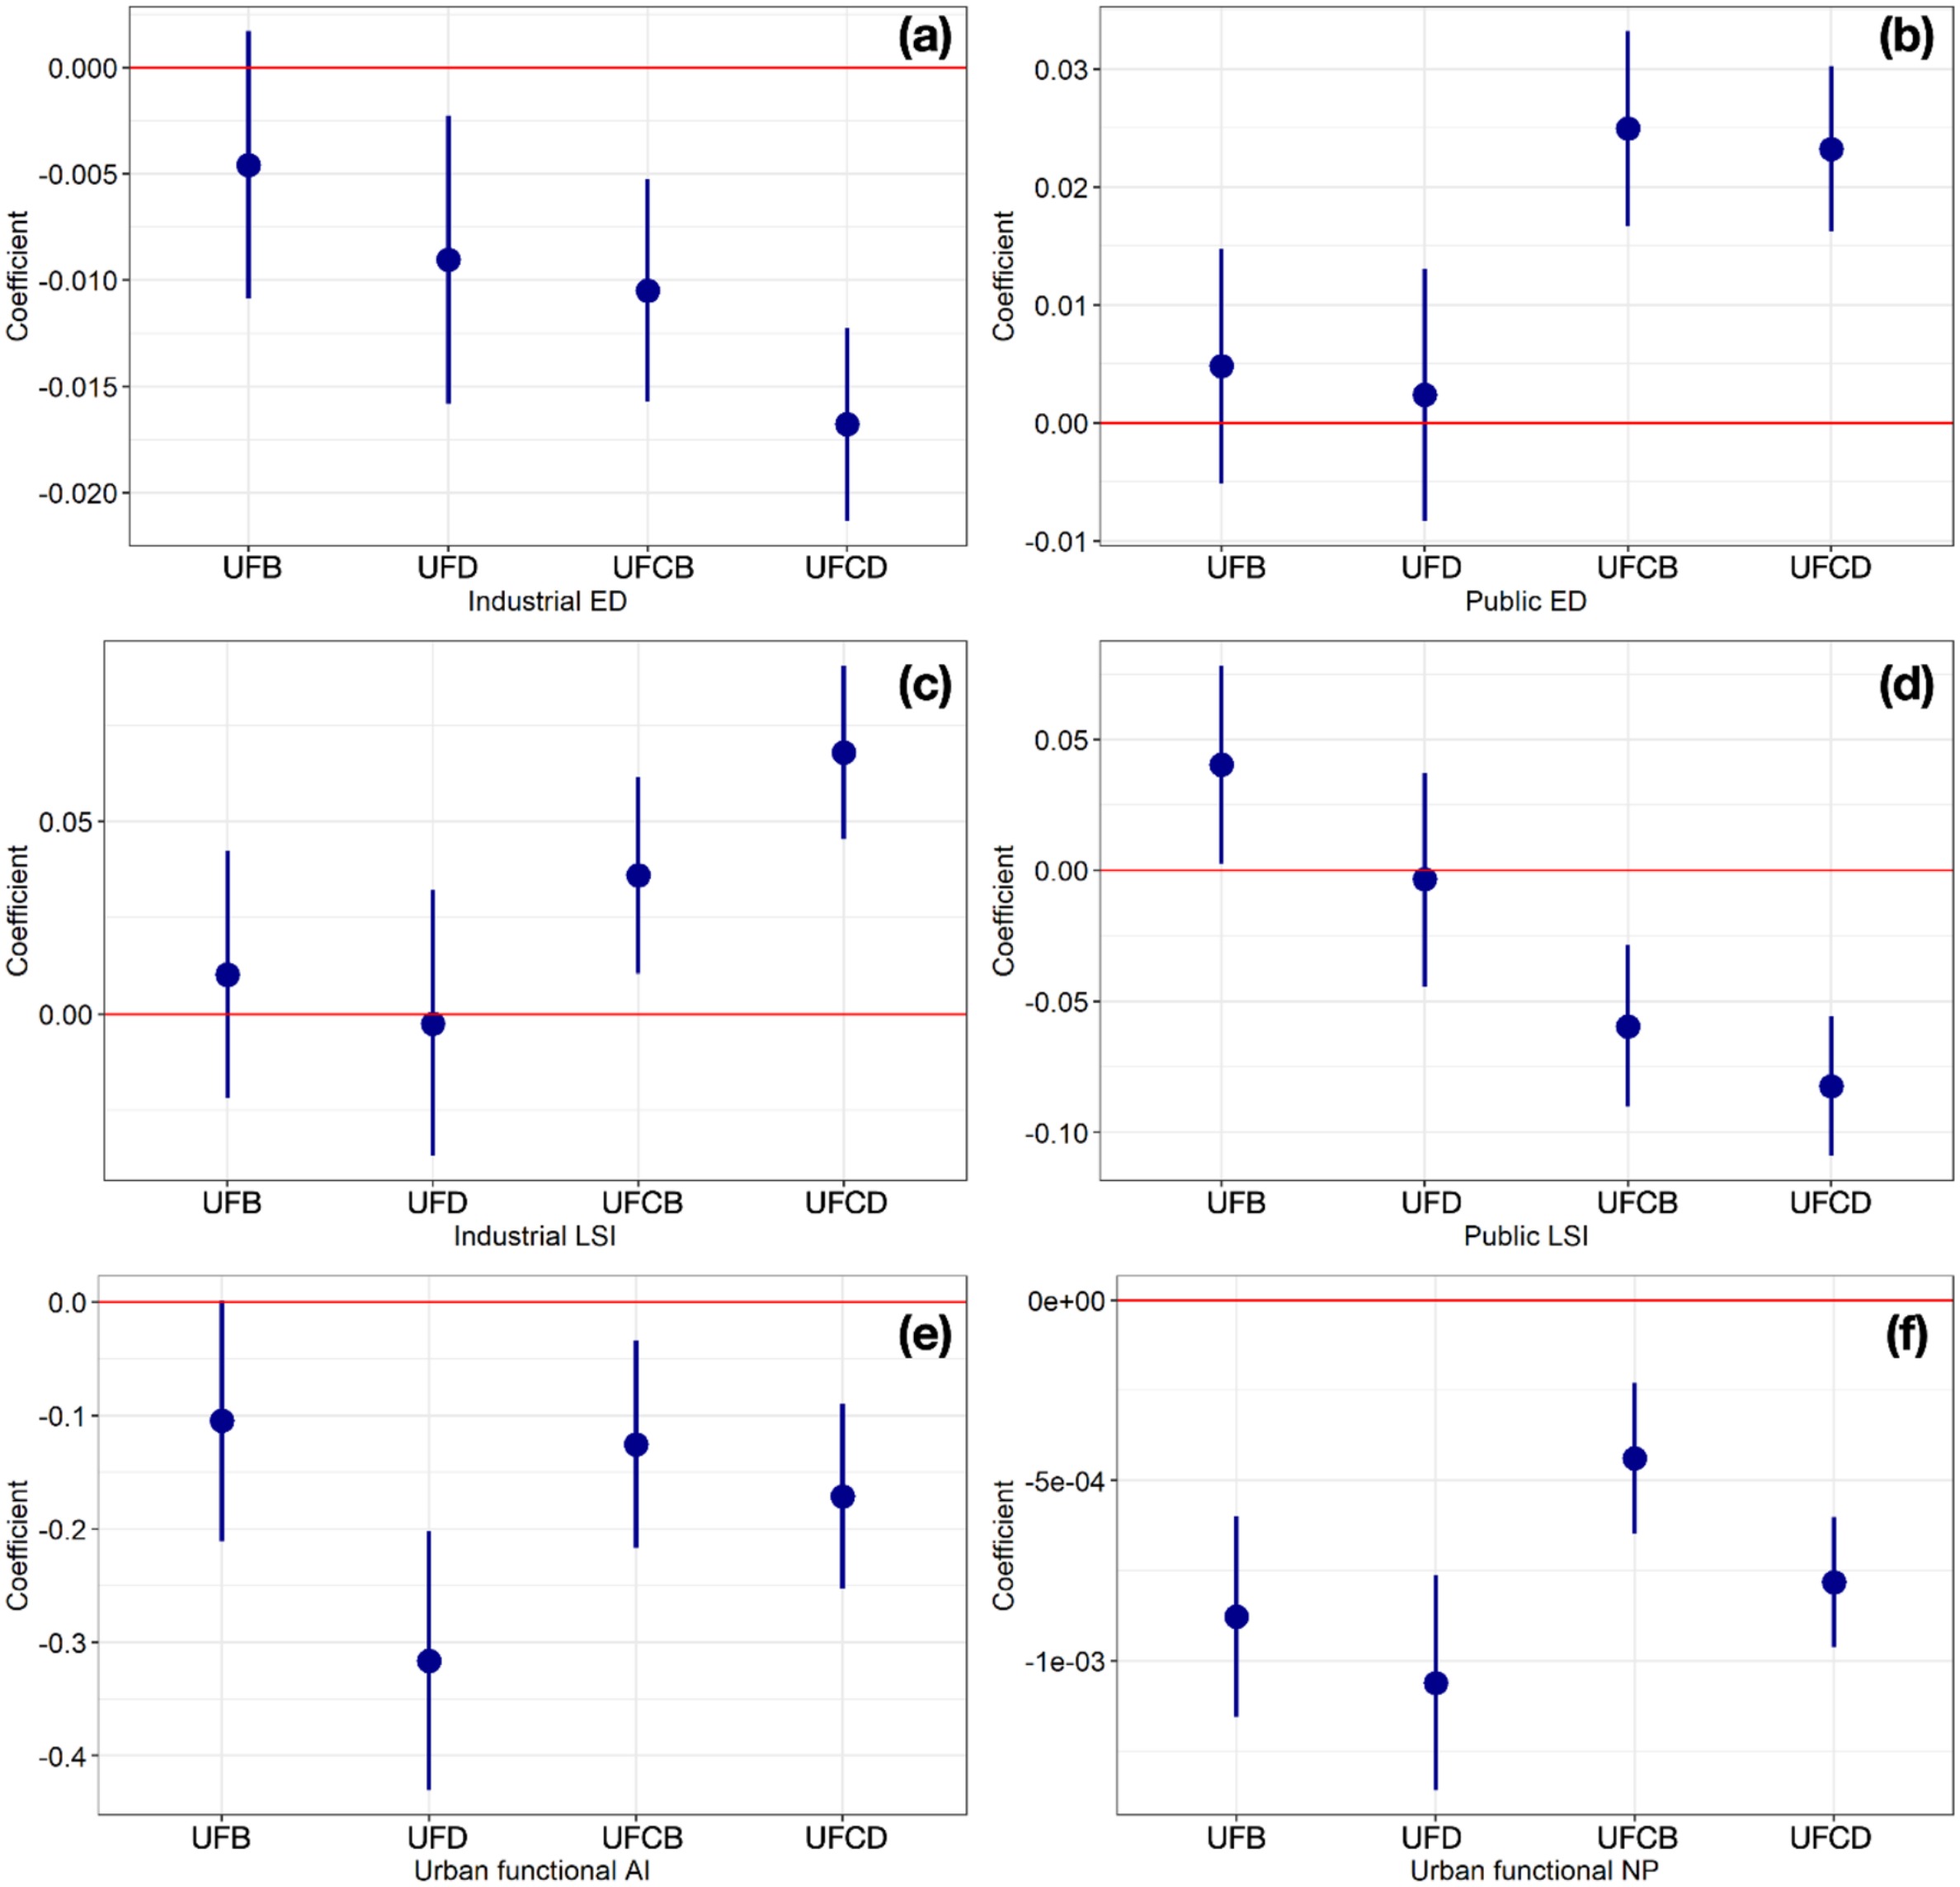
The lockdown in China removed a large share of anthropogenic emission at once, which makes the contribution of urban form separable from the contribution of activity. NO2 variation was quantified with a SARIMAX model combined with dynamic time warping, and urban functional fragmentation was described by industrial and public edge density and landscape shape index, together with the aggregation index and number of patches. Comparing the fragmentation and NO2 association before and during lockdown gives negative effects of industrial edge density, public landscape shape index, aggregation index, and number of patches, and positive effects of public edge density and industrial landscape shape index. The configuration of urban function, not only how much of it there is, conditions how much NO2 an emission restriction actually removes.
Cities · 2024 · first author
Built environment and the collapse of urban space usage
Meng, Y., Ho, H. C., & Wong, M. S. (2024). Changing associations of built environment with usage of urban space due to the COVID-19 pandemic in the United States. Cities, 152, 105205.
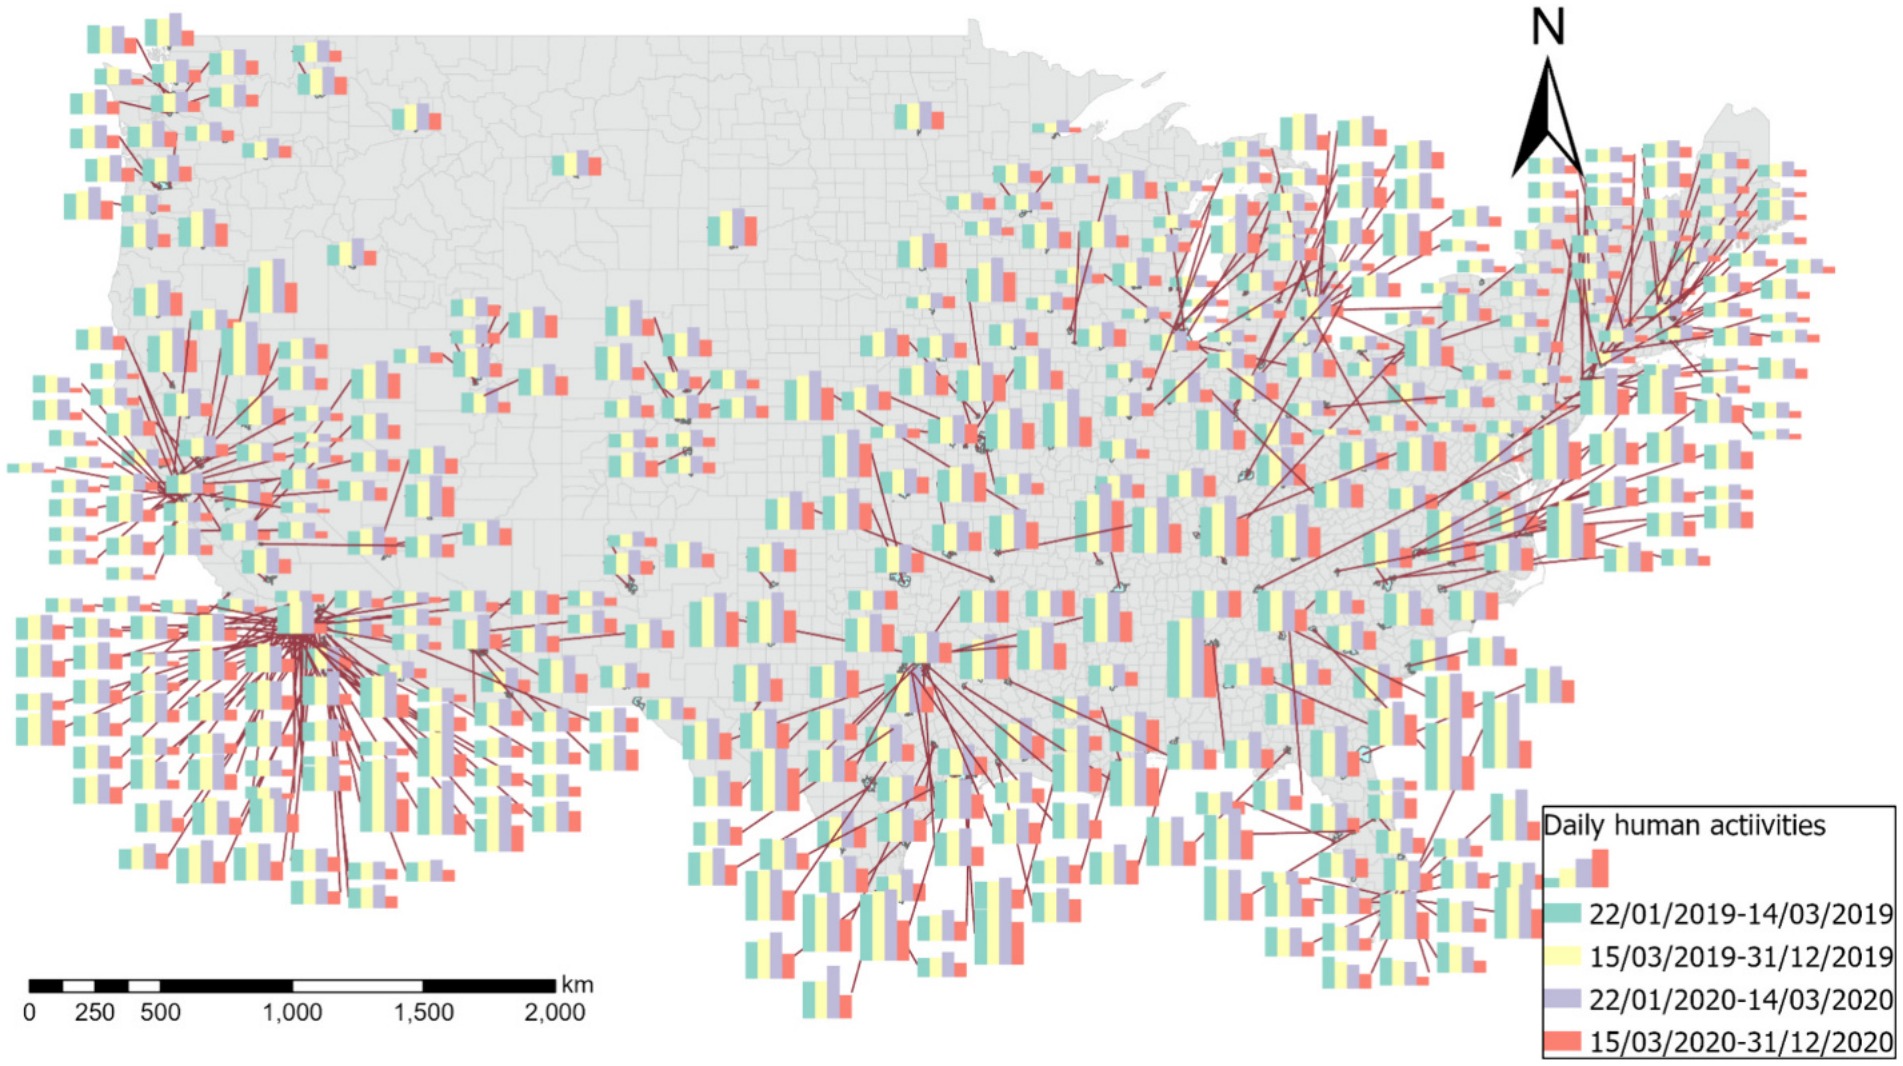
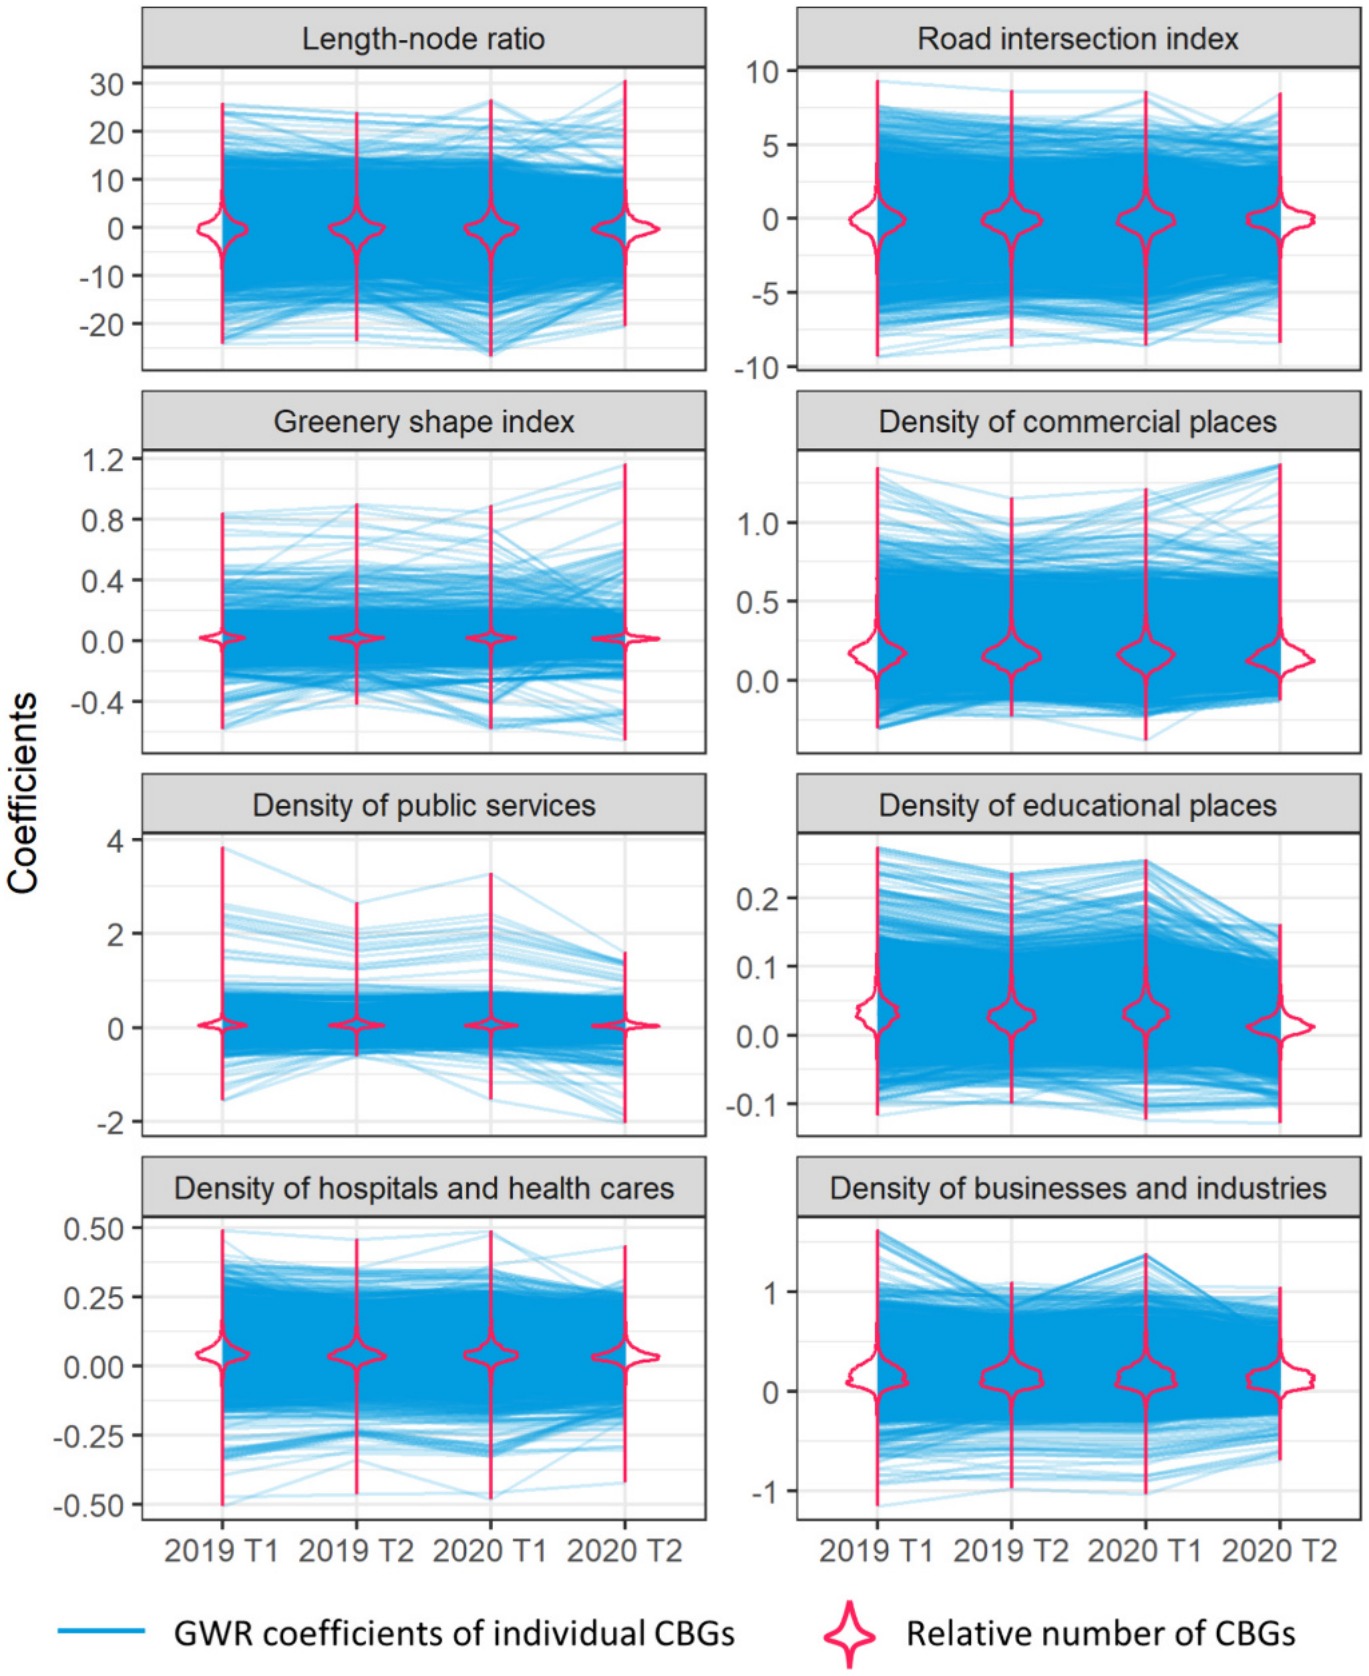
A total of 57,185 census block groups across 459 United States cities were analyzed, with usage of urban space measured from over two billion mobile phone records before and during the pandemic. Usage fell by between 0.25 percent and 76.35 percent depending on the city, a range wide enough that any national average describes few of them.
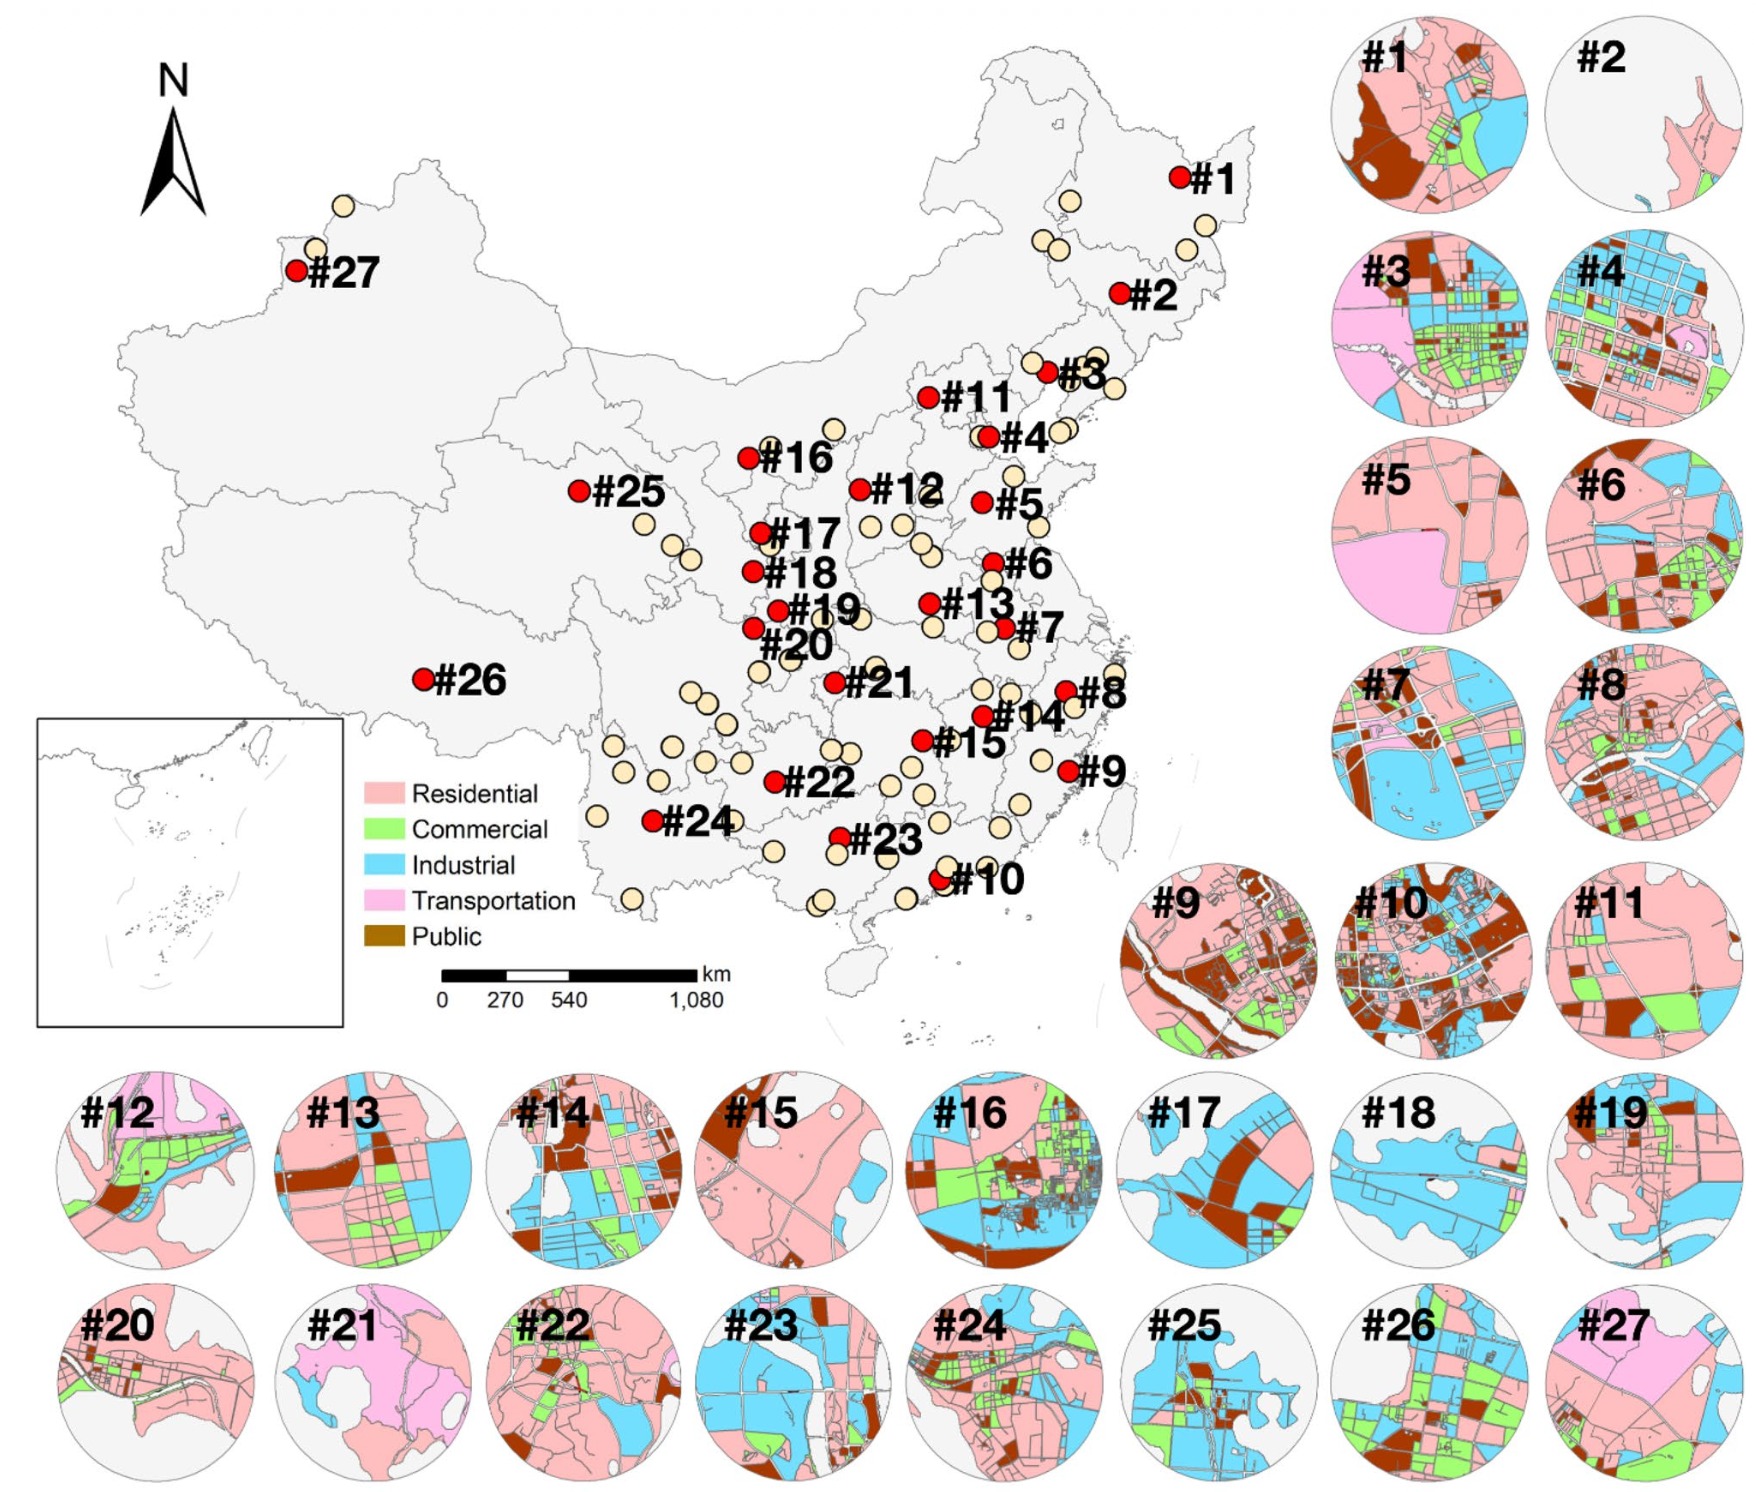
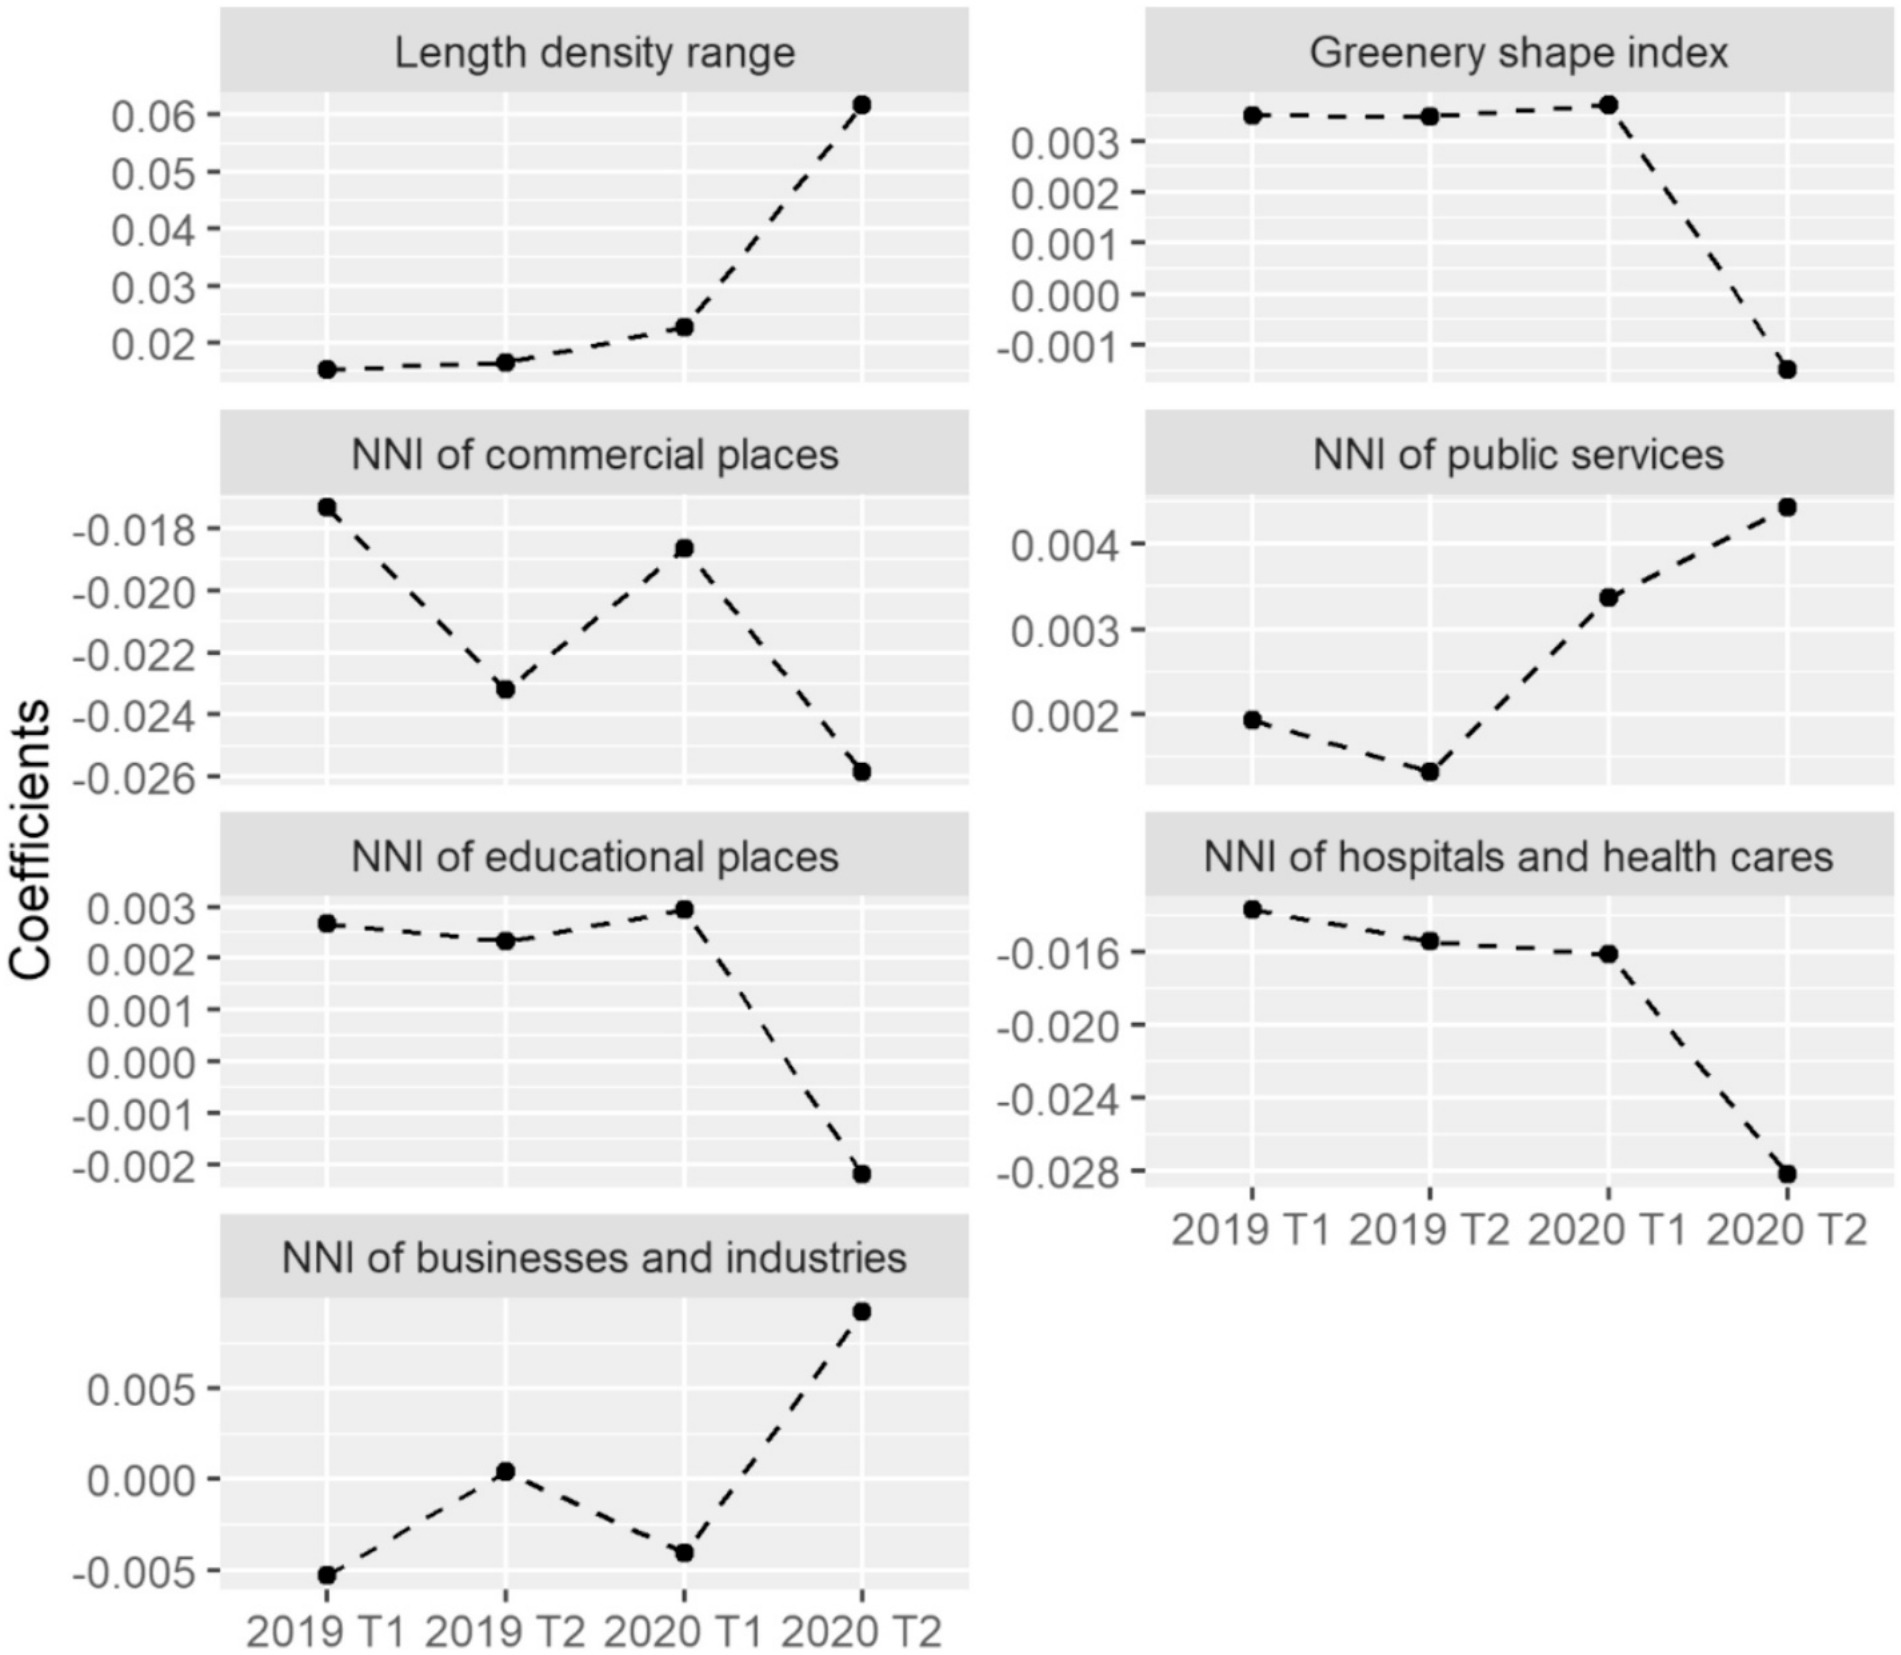
Geographically weighted regression related that change to road network, green space, and land use, estimated at both census block group and city level. Road length-node ratio, road intersection index, and land use densities carried the strongest block-group associations, and the coefficients moved between periods: the built environment features that predicted where people went before the pandemic are not the ones that predicted it during. Fitting at two scales shows that the association belongs to neighborhoods as well as to cities, and that a city-level model alone would attribute to the city what varies within it.
Continuity
Where this leads
COVID-19 was the first health outcome this research program estimated at population scale, and the design choices it forced carry into everything after it. The urban form and land use measures used here were built in the sensing work. Two lessons went forward: re-derive the outcome rather than accept the recorded count, which is why the cognitive health studies model dementia mortality rather than diagnosis; and estimate locally rather than globally, because an exposure effect that changes sign between cities cannot be represented by one coefficient. The mental health work applies the same logic to counties.
Summary
Selected papers
2024 Meng, Y., Ho, H. C., & Wong, M. S. Changing associations of built environment with usage of urban space due to the COVID-19 pandemic in the United States. Cities, 152, 105205.
Urban space usage fell by between 0.25 and 76.35 percent across 459 United States cities, and the built environment features that predicted where people went before the pandemic are not the ones that predicted it during.
2022 Meng, Y., Wong, M. S., Kwan, M.-P., & Zhu, R. Association between global air pollution and COVID-19 mortality: a study of forty-six cities in the world. Annals of the American Association of Geographers, 1–17.
Pooled across forty-six cities the relative risk of NO2 is 1.006 to 1.014; estimated city by city it ranges from 0.754 to 1.245, with associations in both directions.
2021 Meng, Y., Wong, M. S., Xing, H., Zhu, R., Qin, K., Kwan, M.-P., Lee, K. H., Kwok, C. Y. T., & Li, H. Effects of urban functional fragmentation on nitrogen dioxide (NO2) variation with anthropogenic-emission restriction in China. Scientific Reports, 11, 11908.
Lockdown separates urban form from activity: the configuration of urban function, not its quantity, conditions how much NO2 an emission restriction actually removes.
2021 Meng, Y., Wong, M. S., Xing, H., Kwan, M.-P., & Zhu, R. Assessing the country-level excess all-cause mortality and the impacts of air pollution and human activity during the COVID-19 epidemic. International Journal of Environmental Research and Public Health, 18(13), 6883.
Excess all-cause mortality ranged from −26.52 to 373.60 percent and exceeded recorded COVID-19 deaths in most of sixteen countries, and the choice of outcome moves the exposure estimate itself.
2021 Meng, Y., Wong, M. S., Xing, H., Kwan, M.-P., & Zhu, R. Yearly and daily relationship assessment between air pollution and early-stage COVID-19 incidence: evidence from 231 countries and regions. ISPRS International Journal of Geo-Information, 10(6), 401.
Air pollution and case associations are non-stationary in space and time, and daily NO2 carries the opposite sign to its yearly discrepancy.