Sensing Place: Measuring Urban Function & Deprivation
Methods for inferring what urban places are for, how intensely they are used, and where disadvantage concentrates, from landscape form, human activity, and street-level imagery.
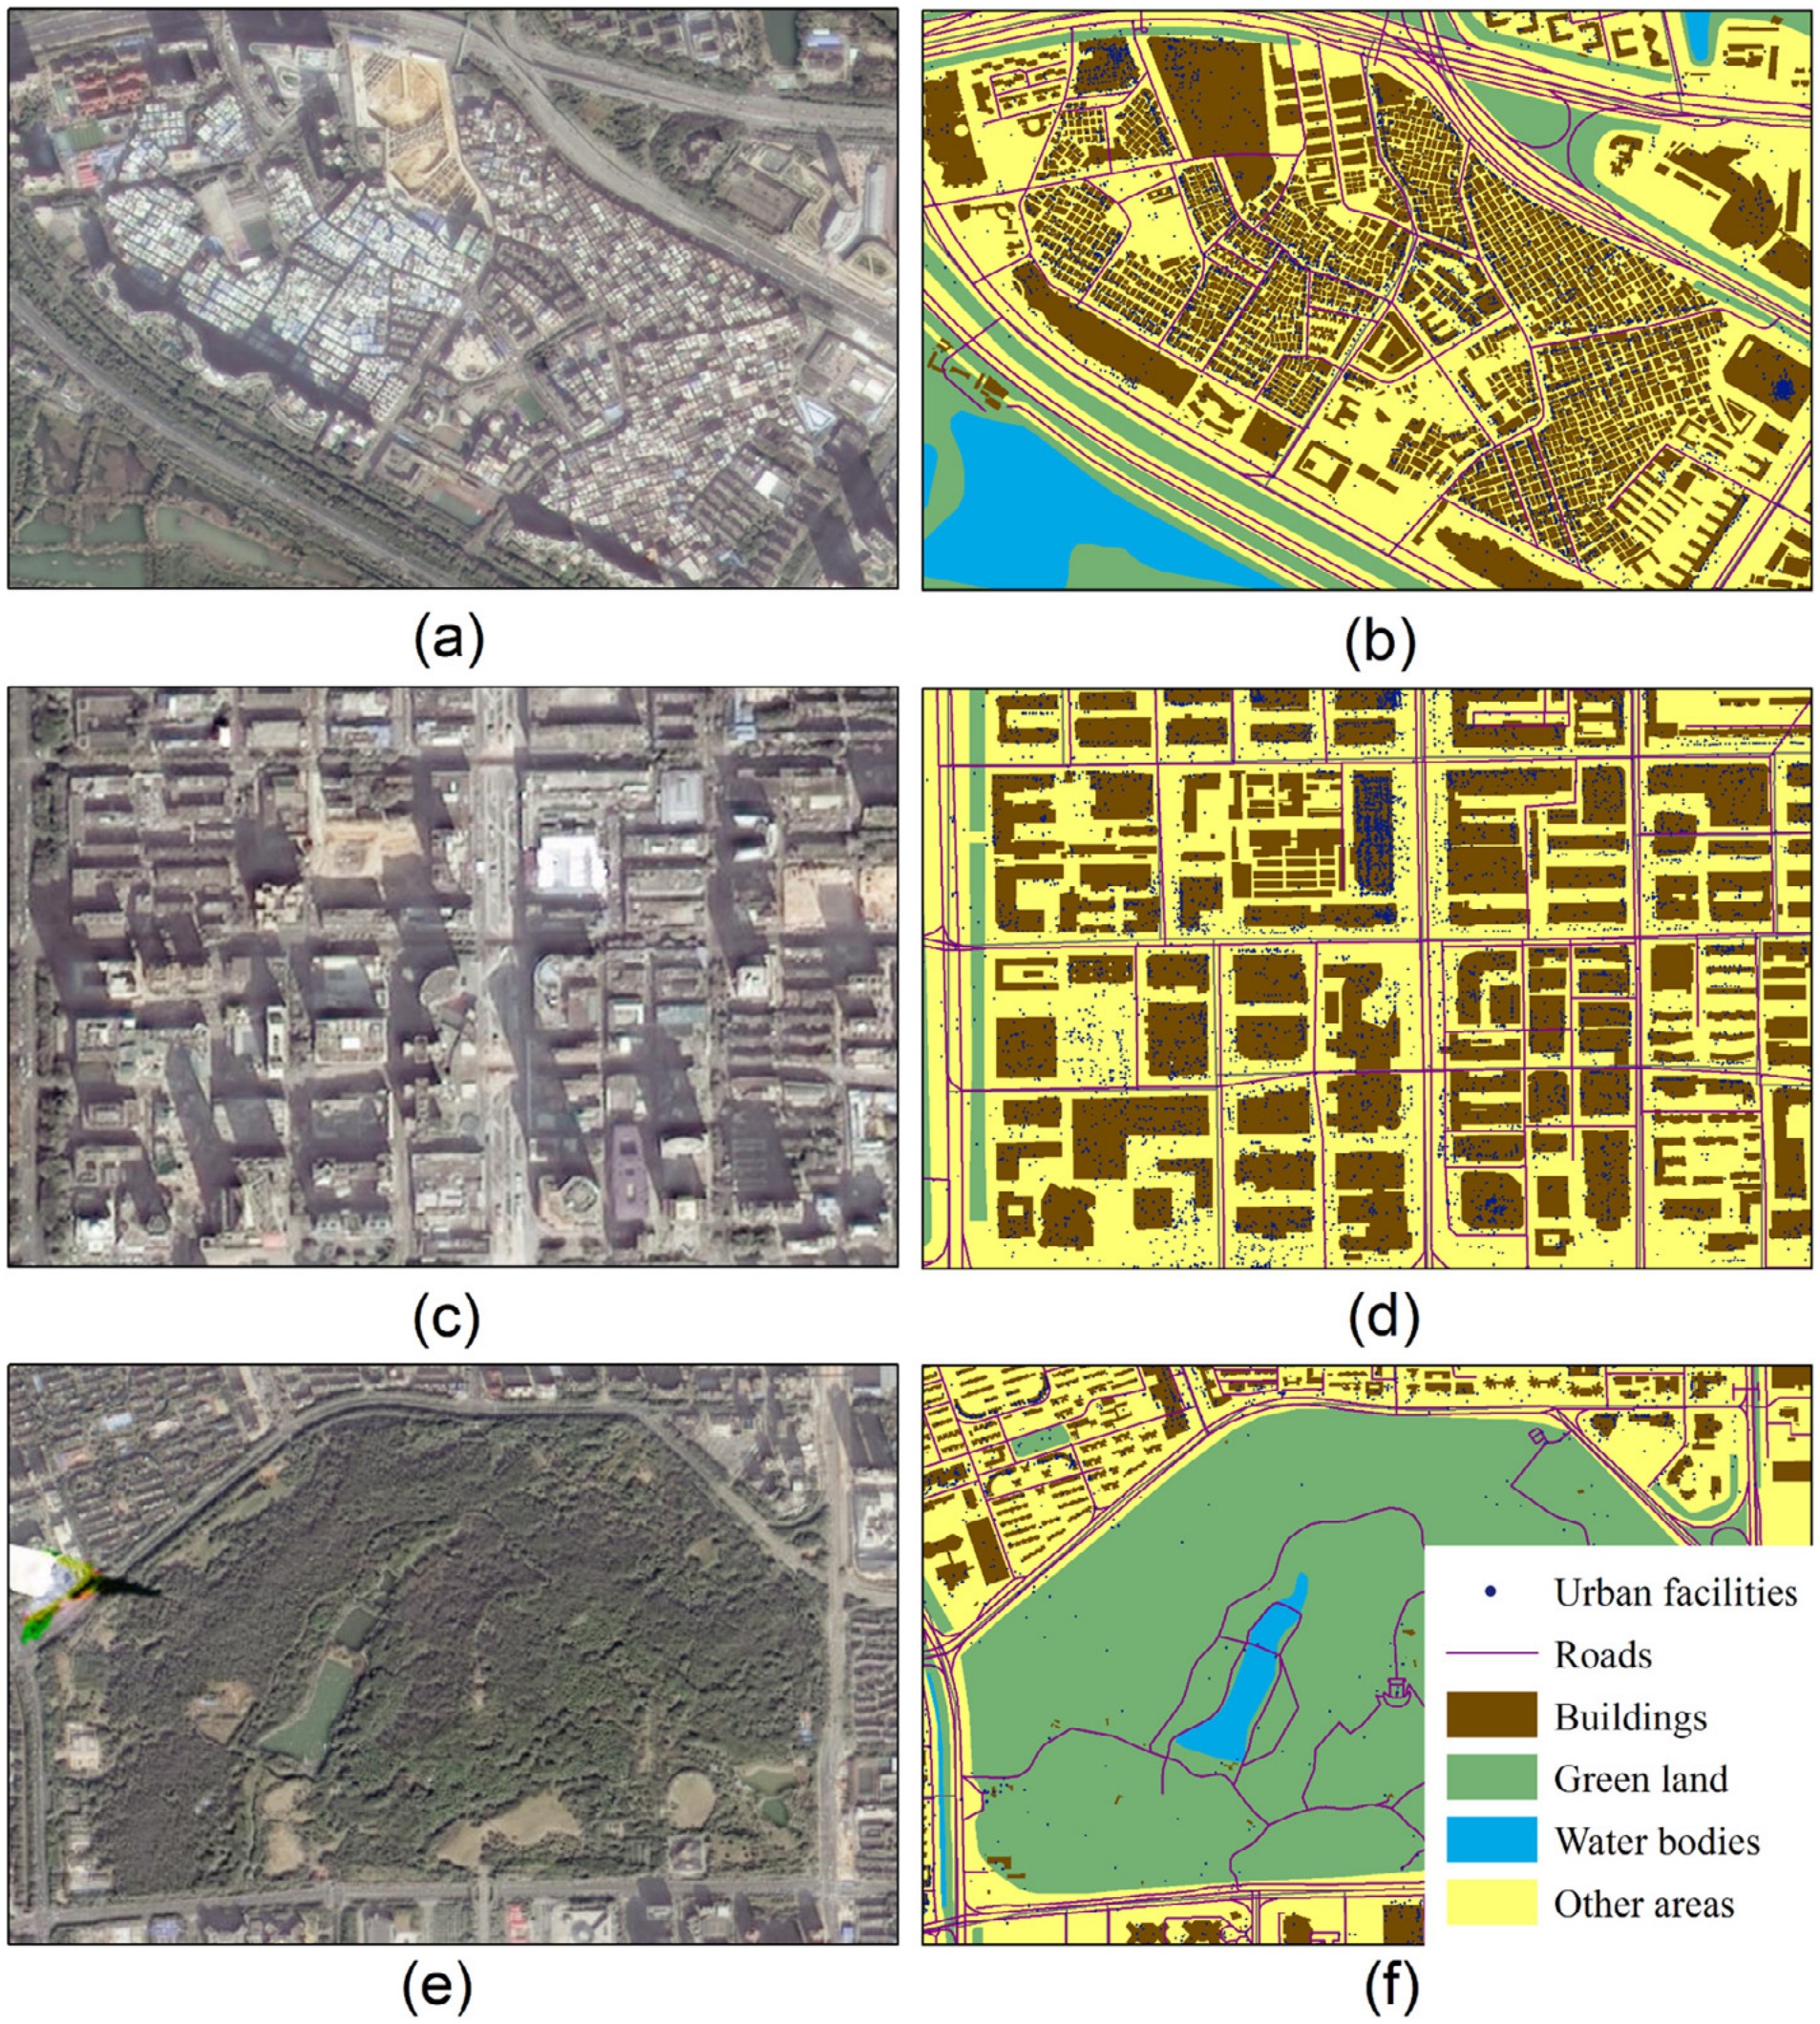
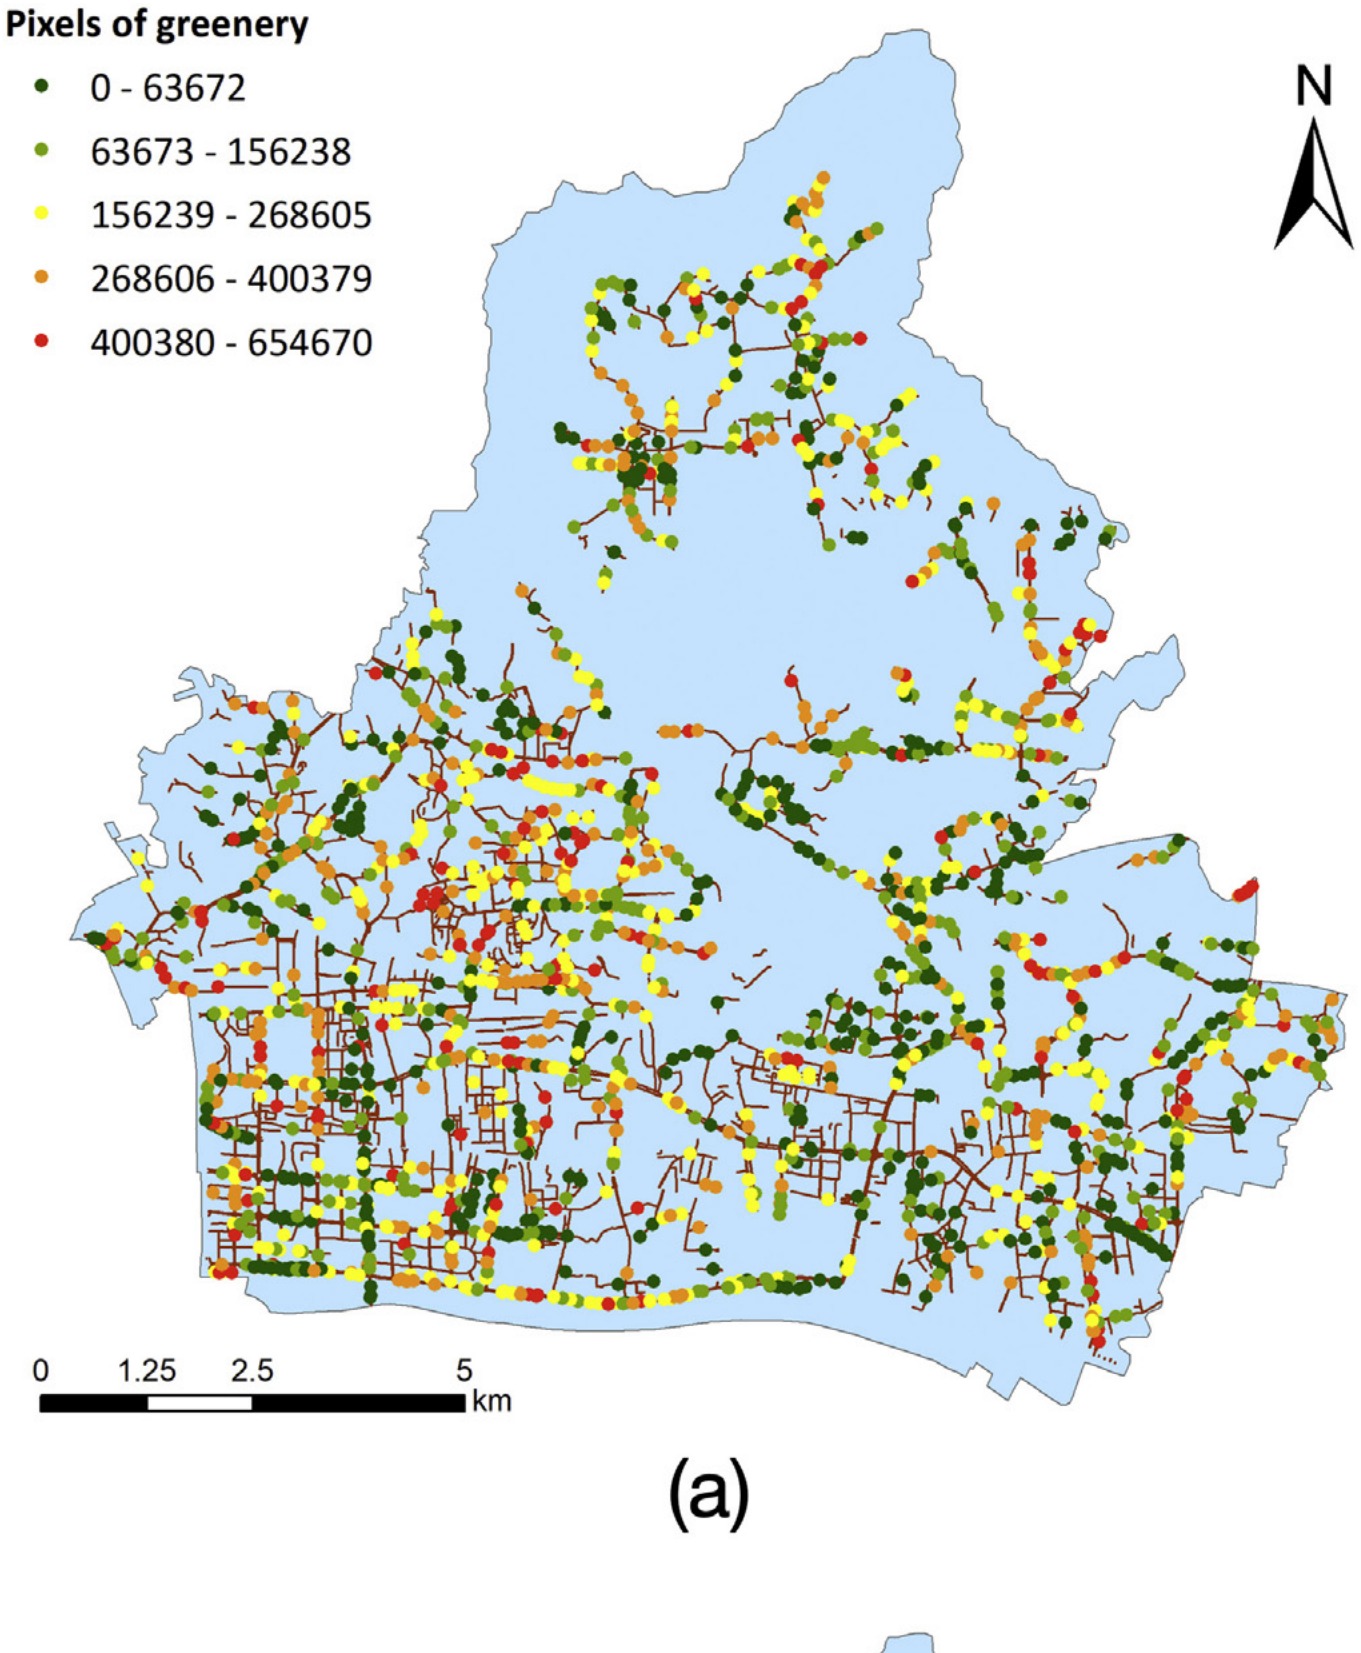
Left: Xing and Meng*, Ecological Indicators (2020). Right: Meng et al., Computers, Environment and Urban Systems (2020).
Research question
What do form and activity reveal about function and disadvantage?
Official land use records state what a parcel is designated for, not what it does. They are revised infrequently, defined at administrative rather than behavioral boundaries, and silent on two properties that matter for population health: how intensely a place is used, and how disadvantaged the people who live there are. An exposure model built on designation alone therefore misses most of what distinguishes one neighborhood from another.
The six studies collected here derive those properties from data the city already produces. Building footprints and road networks describe landscape form. Points of interest and place-based reviews describe activity and its timing. Street view imagery describes what a resident sees at eye level. Taken together they establish a sequence: urban function can be classified from physical form, refined by human activity, and then extended to measure vibrancy and material deprivation at parcel scale.
Approach
Three moves across six studies
Delineate
Road networks and building-level blocks partition the city into functional regions and parcels. These are the units at which every subsequent measure is computed, so they are chosen to follow the street pattern rather than administrative lines.
Characterize
Spatial metrics quantify the composition, shape, and aggregation of buildings, green land, and water within each unit. Topic models read the semantics and timing of points of interest and reviews; a segmentation network reads street view imagery.
Relate
Random forests classify function against reference land use. Structural equation and geographically weighted regression models relate landscape composition to commercial pattern, to vibrancy, and to deprivation.
Theme 1
Reading function from urban form
Both studies below ask how far physical form alone determines the function a parcel serves, and what has to be added when it does not.
Ecological Indicators · 2020 · corresponding author
Spatial metrics as a description of urban form
Xing, H., & Meng, Y.* (2020). Measuring urban landscapes for urban function classification using spatial metrics. Ecological Indicators, 108, 105722.
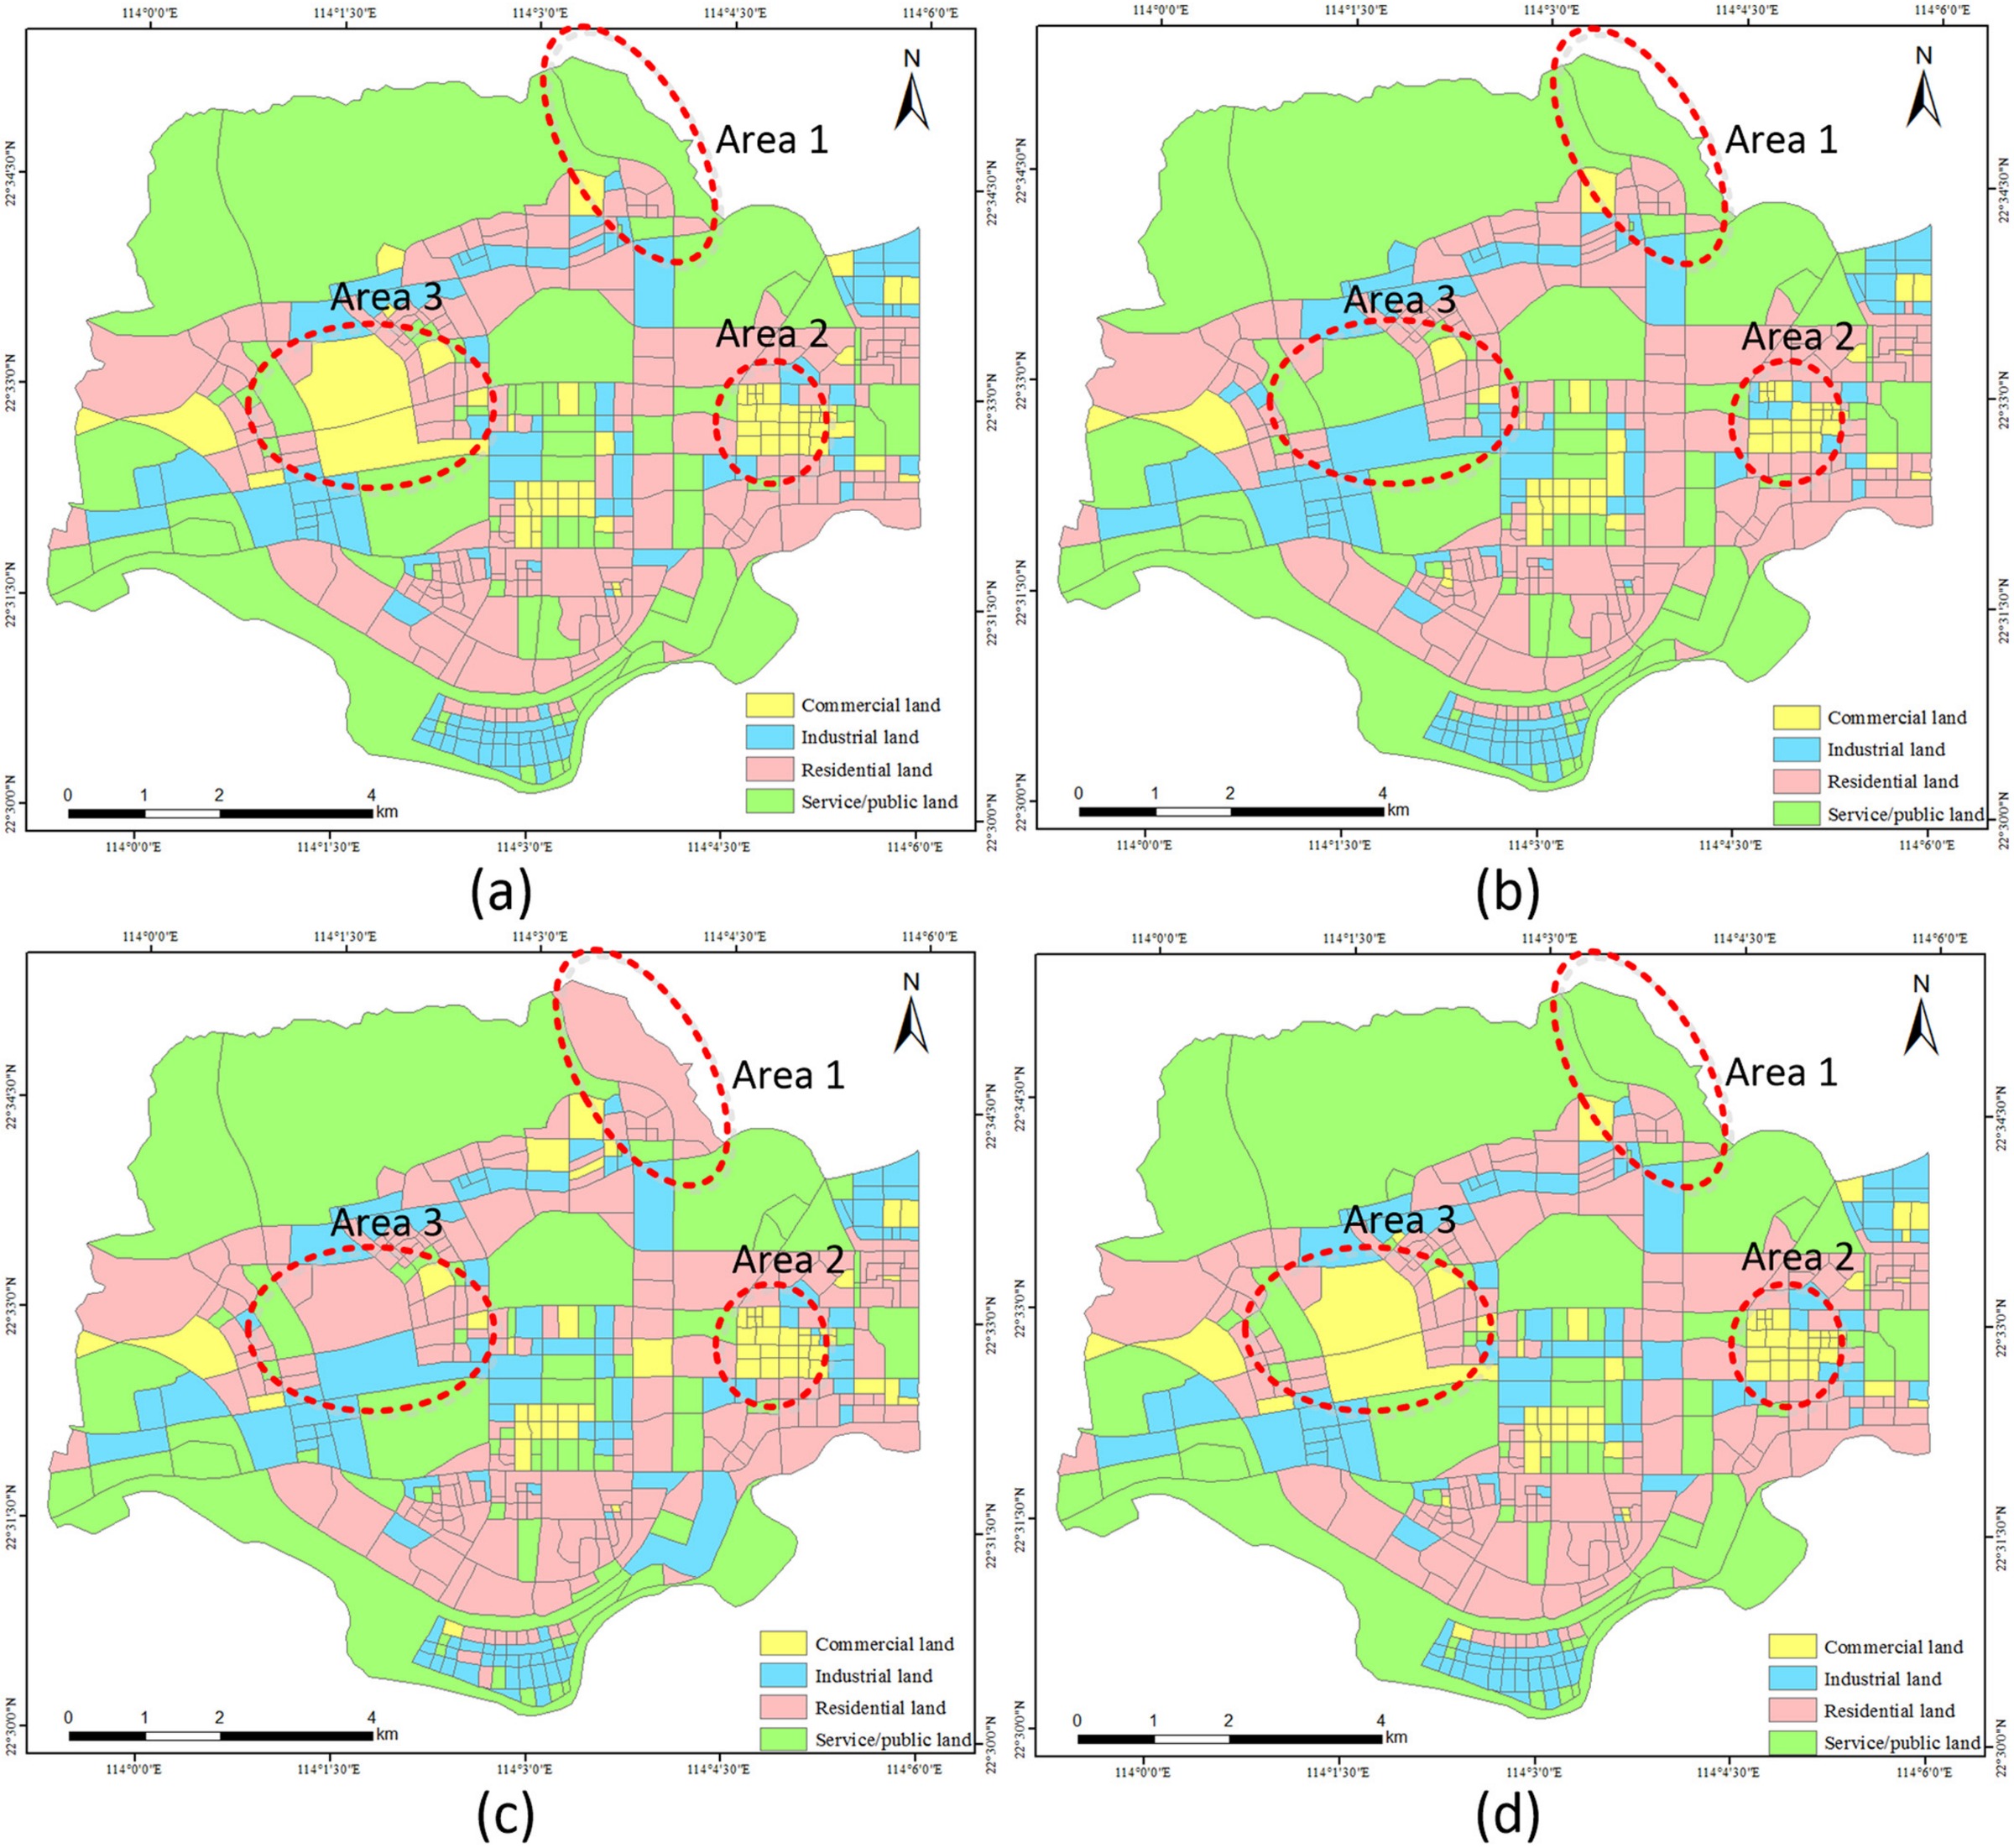
Urban landscapes were represented as configurations of four element types, buildings, green land, water bodies, and other areas, within parcels delineated from the road network. Spatial metrics describing the composition, shape, and aggregation of those elements were computed for each parcel and used to classify residential, commercial and business, and public and service functions. A conditional inference random forest reached 0.813 classification accuracy and 0.757 testing accuracy, ahead of naive Bayes, support vector machines, and a standard random forest. Public and service functions remained the hardest class, which is the expected failure mode when a classifier sees only physical form.
Computers, Environment and Urban Systems · 2018 · corresponding author
Adding socioeconomic evidence to physical form
Xing, H., & Meng, Y.* (2018). Integrating landscape metrics and socioeconomic features for urban functional region classification. Computers, Environment and Urban Systems, 72, 134–145.
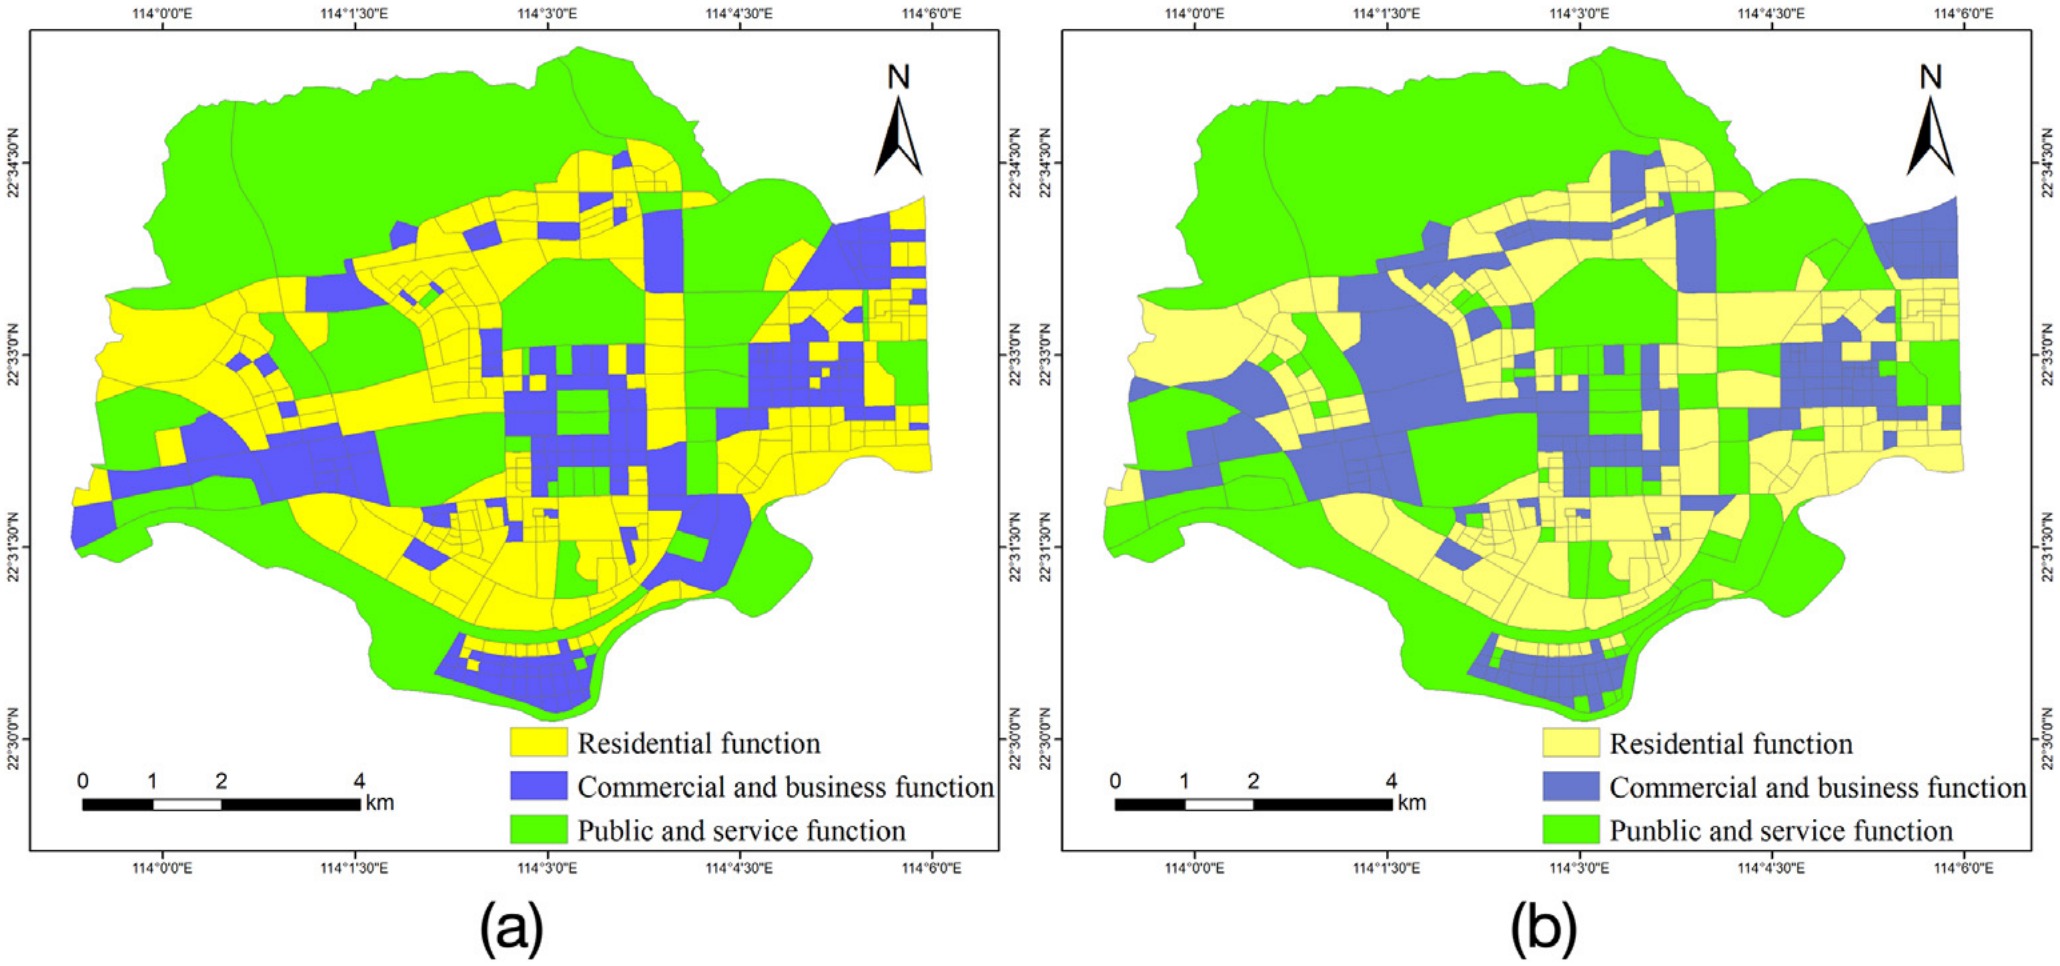
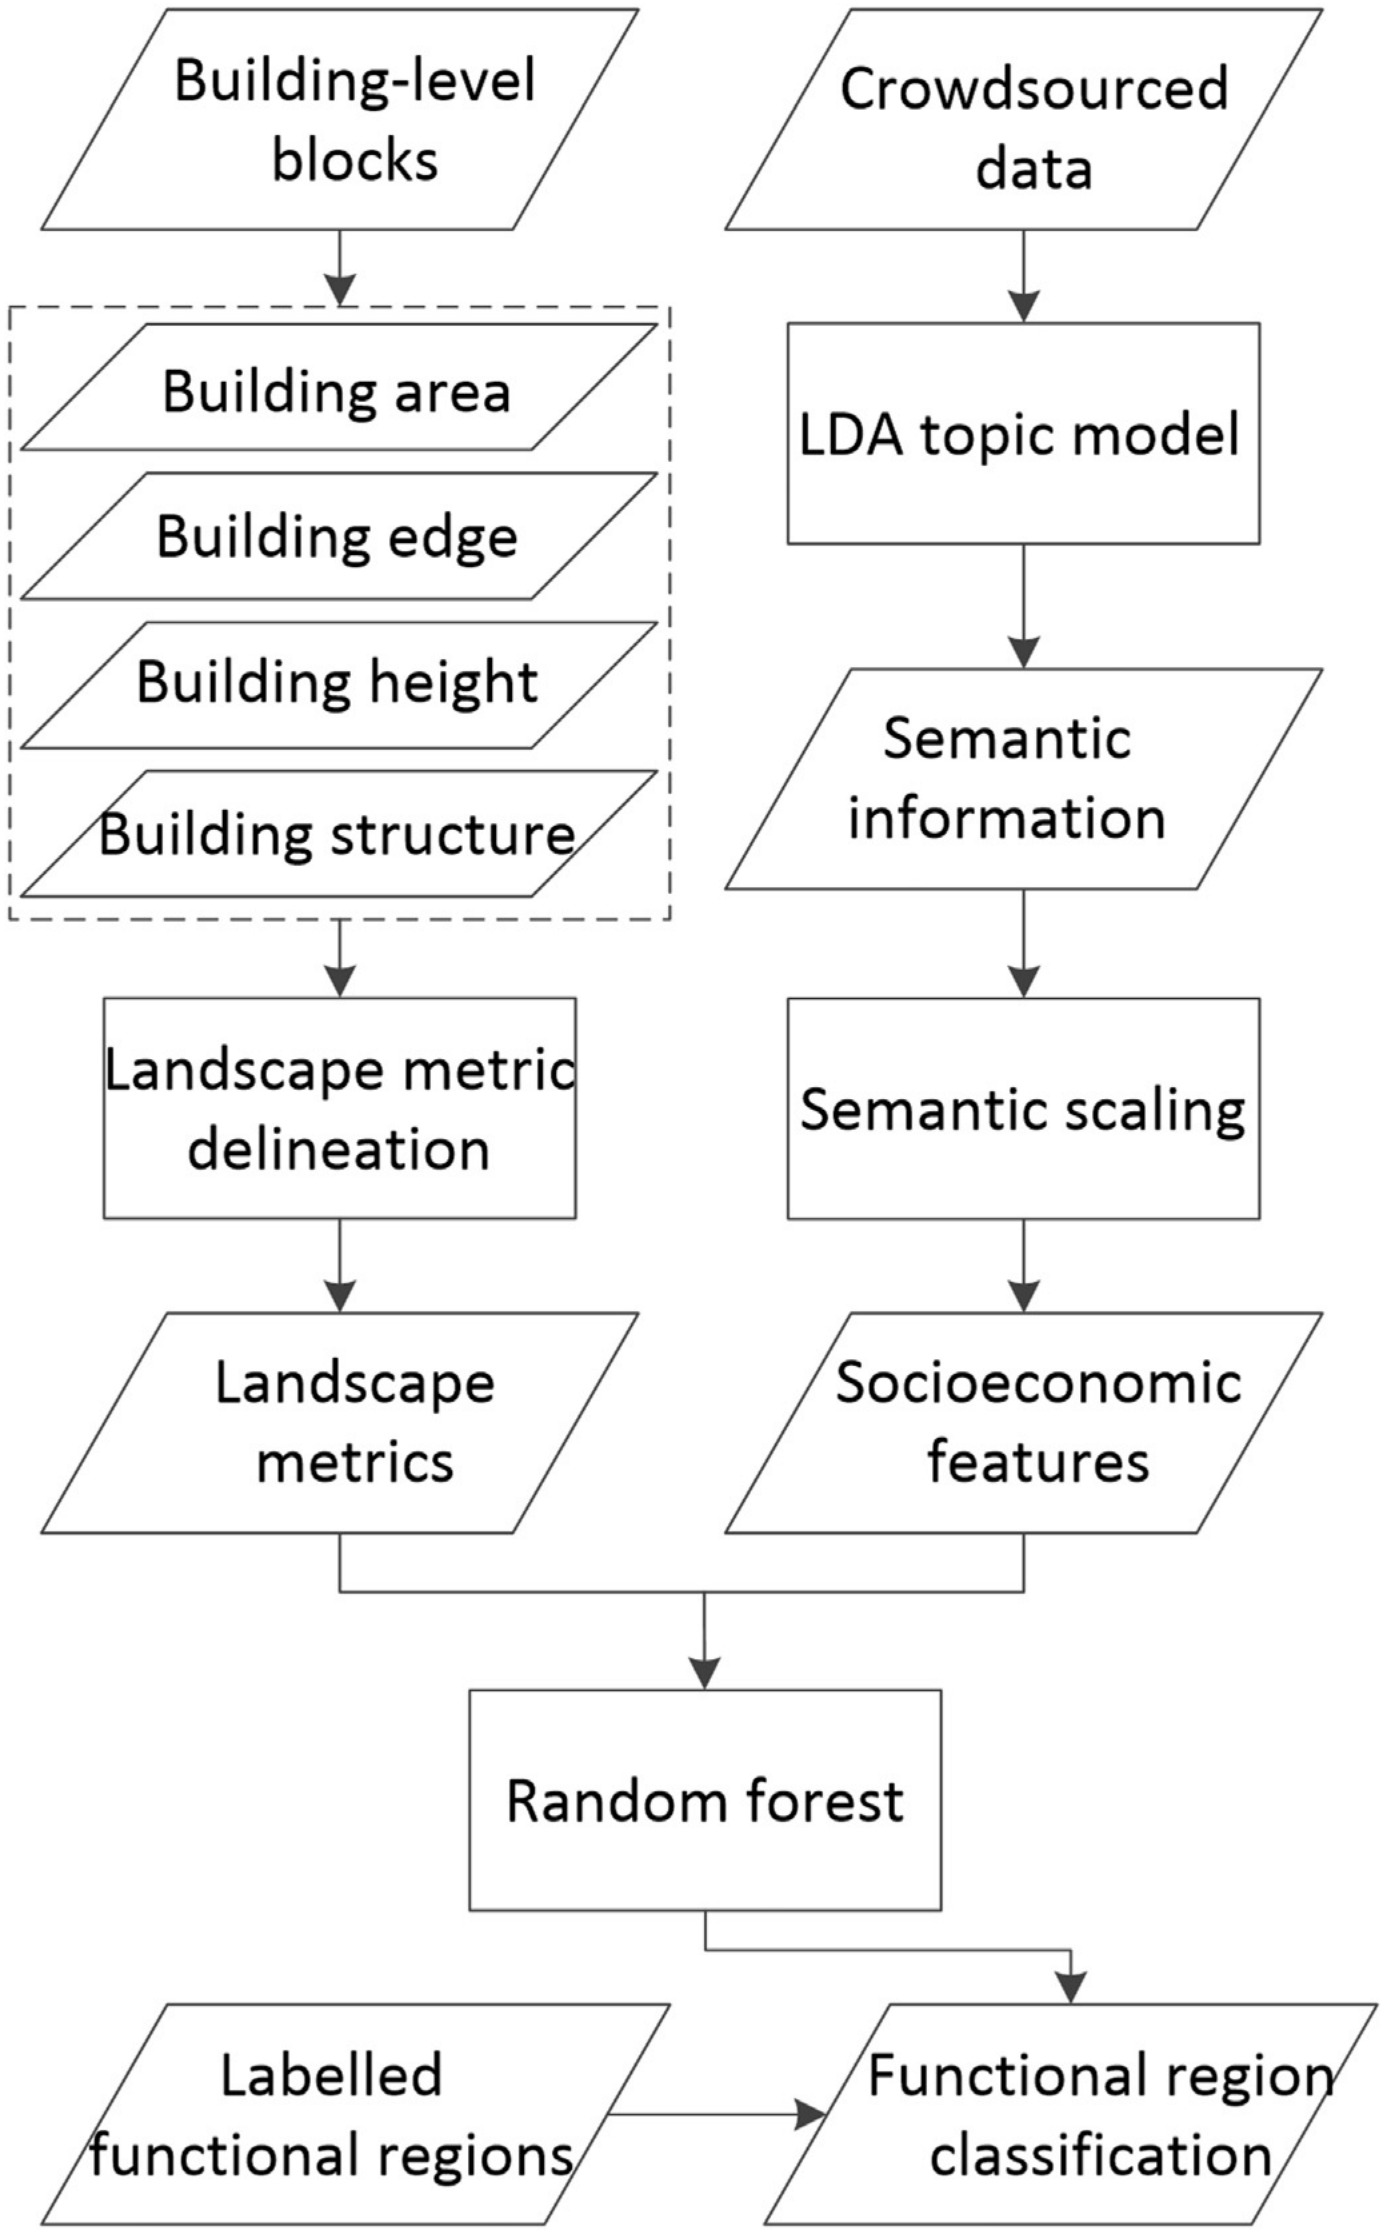
Eighteen landscape metrics were delineated from building-level blocks and combined with four socioeconomic features derived from 139,921 points of interest, then used by a random forest to classify functional regions delineated from the road network. Landscape metrics alone and socioeconomic features alone each reached 0.664 overall accuracy; used together they reached 0.818 with a kappa of 0.734. Physical form and social content are therefore complementary rather than substitutable, and a classifier given only one of them is leaving accuracy on the table.
Theme 2
Reading function from human activity
Physical form is static. The two studies below add what people do in a place, drawn from the timing and the semantics of what they post about it.
Transactions in GIS · 2018 · corresponding author
Mixed land use from the rhythm of human activity
Xing, H., Meng, Y.*, & Shi, Y. (2018). A dynamic human activity-driven model for mixed land use evaluation using social media data. Transactions in GIS, 22(5), 1130–1151.
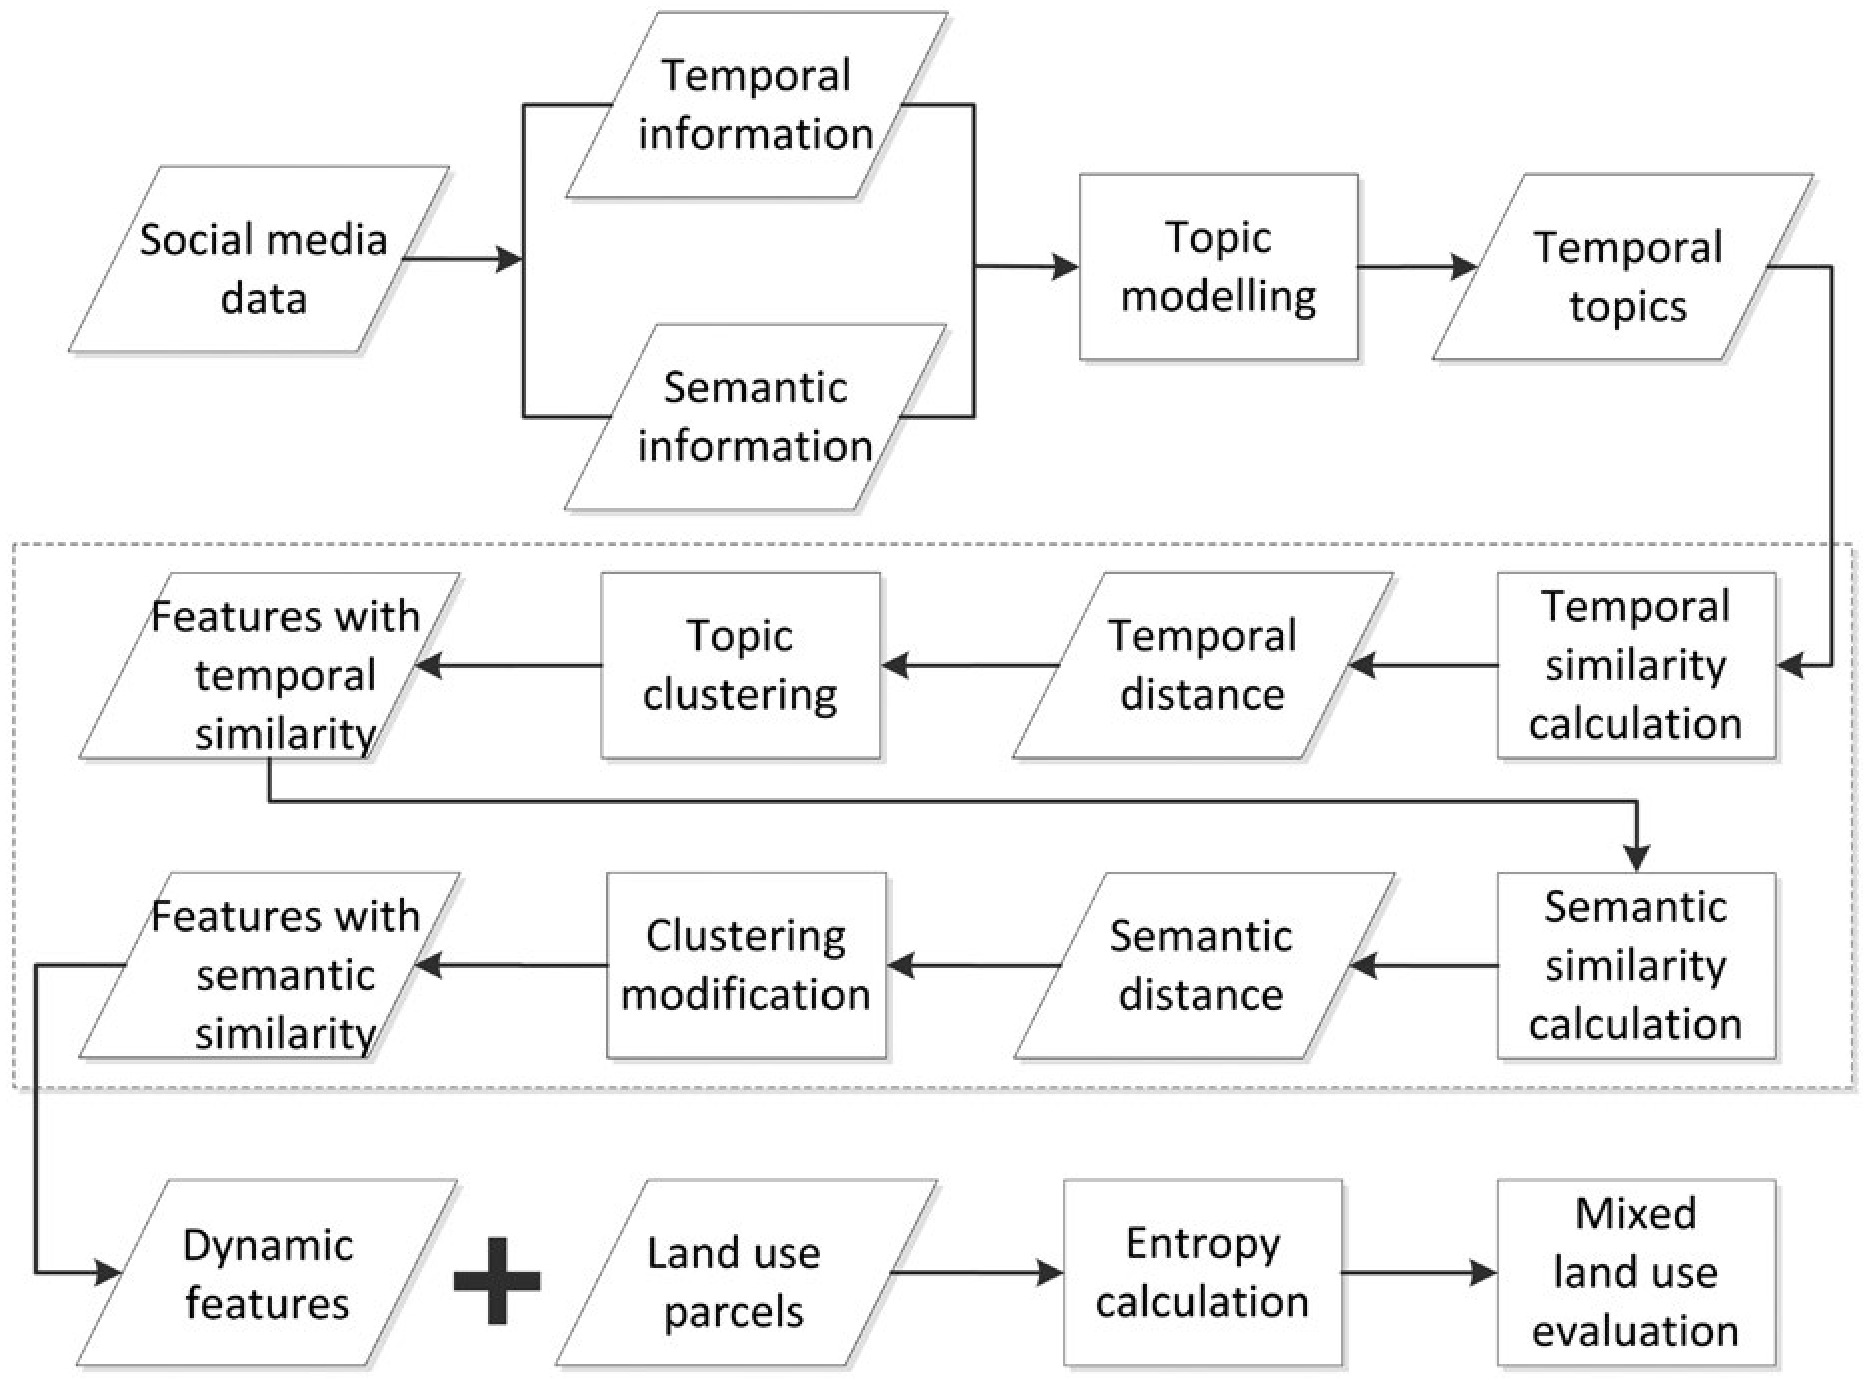
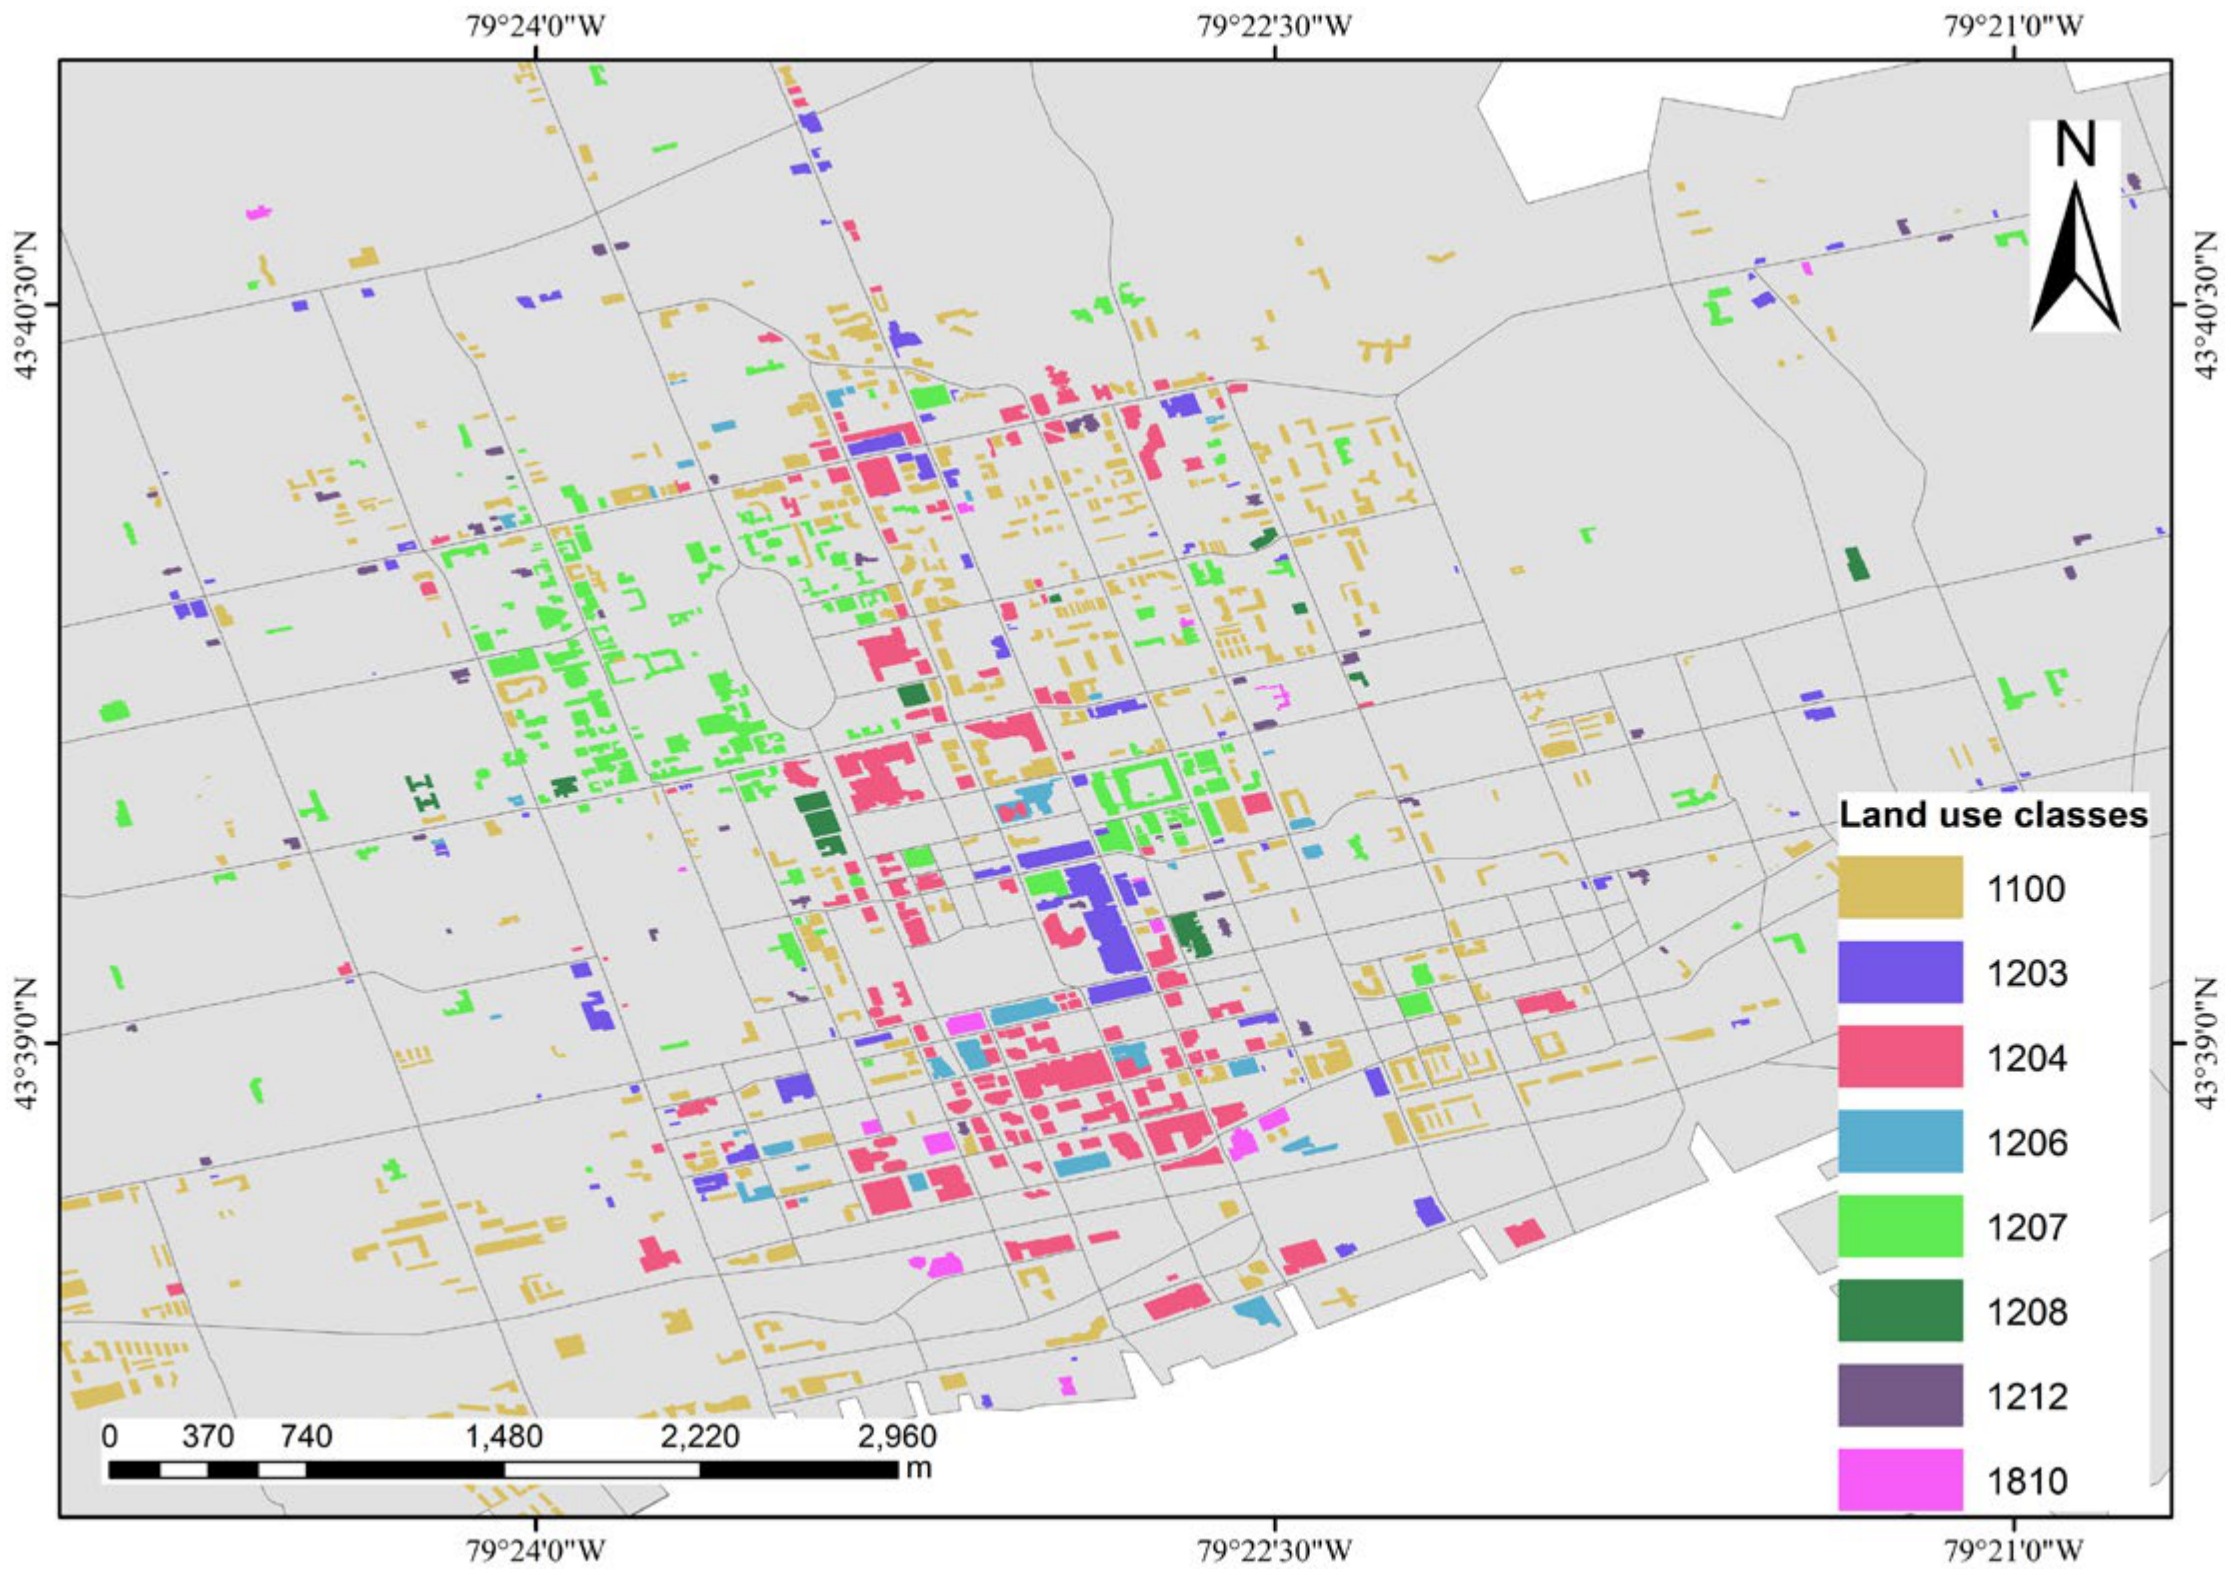
Latent Dirichlet allocation extracted thirty topics from geotagged social media, each carrying a temporal profile as well as a semantic one. Topics with similar temporal distributions were clustered hierarchically, the clusters were then modified by semantic distance, and the result is a set of dynamic features describing when a parcel is used and for what. Shannon entropy over those features measured mixed land use. Validated against labelled buildings, dynamic features gave a Pearson correlation of 0.750, against 0.119 for semantic features alone: timing, not vocabulary, is what distinguishes one land use mixture from another.
Computers, Environment and Urban Systems · 2020 · corresponding author
Commercial pattern as a function of the surrounding landscape
Xing, H., & Meng, Y.* (2020). Revealing deep semantic commercial patterns: insights from urban landscape depiction. Computers, Environment and Urban Systems, 79, 101404.
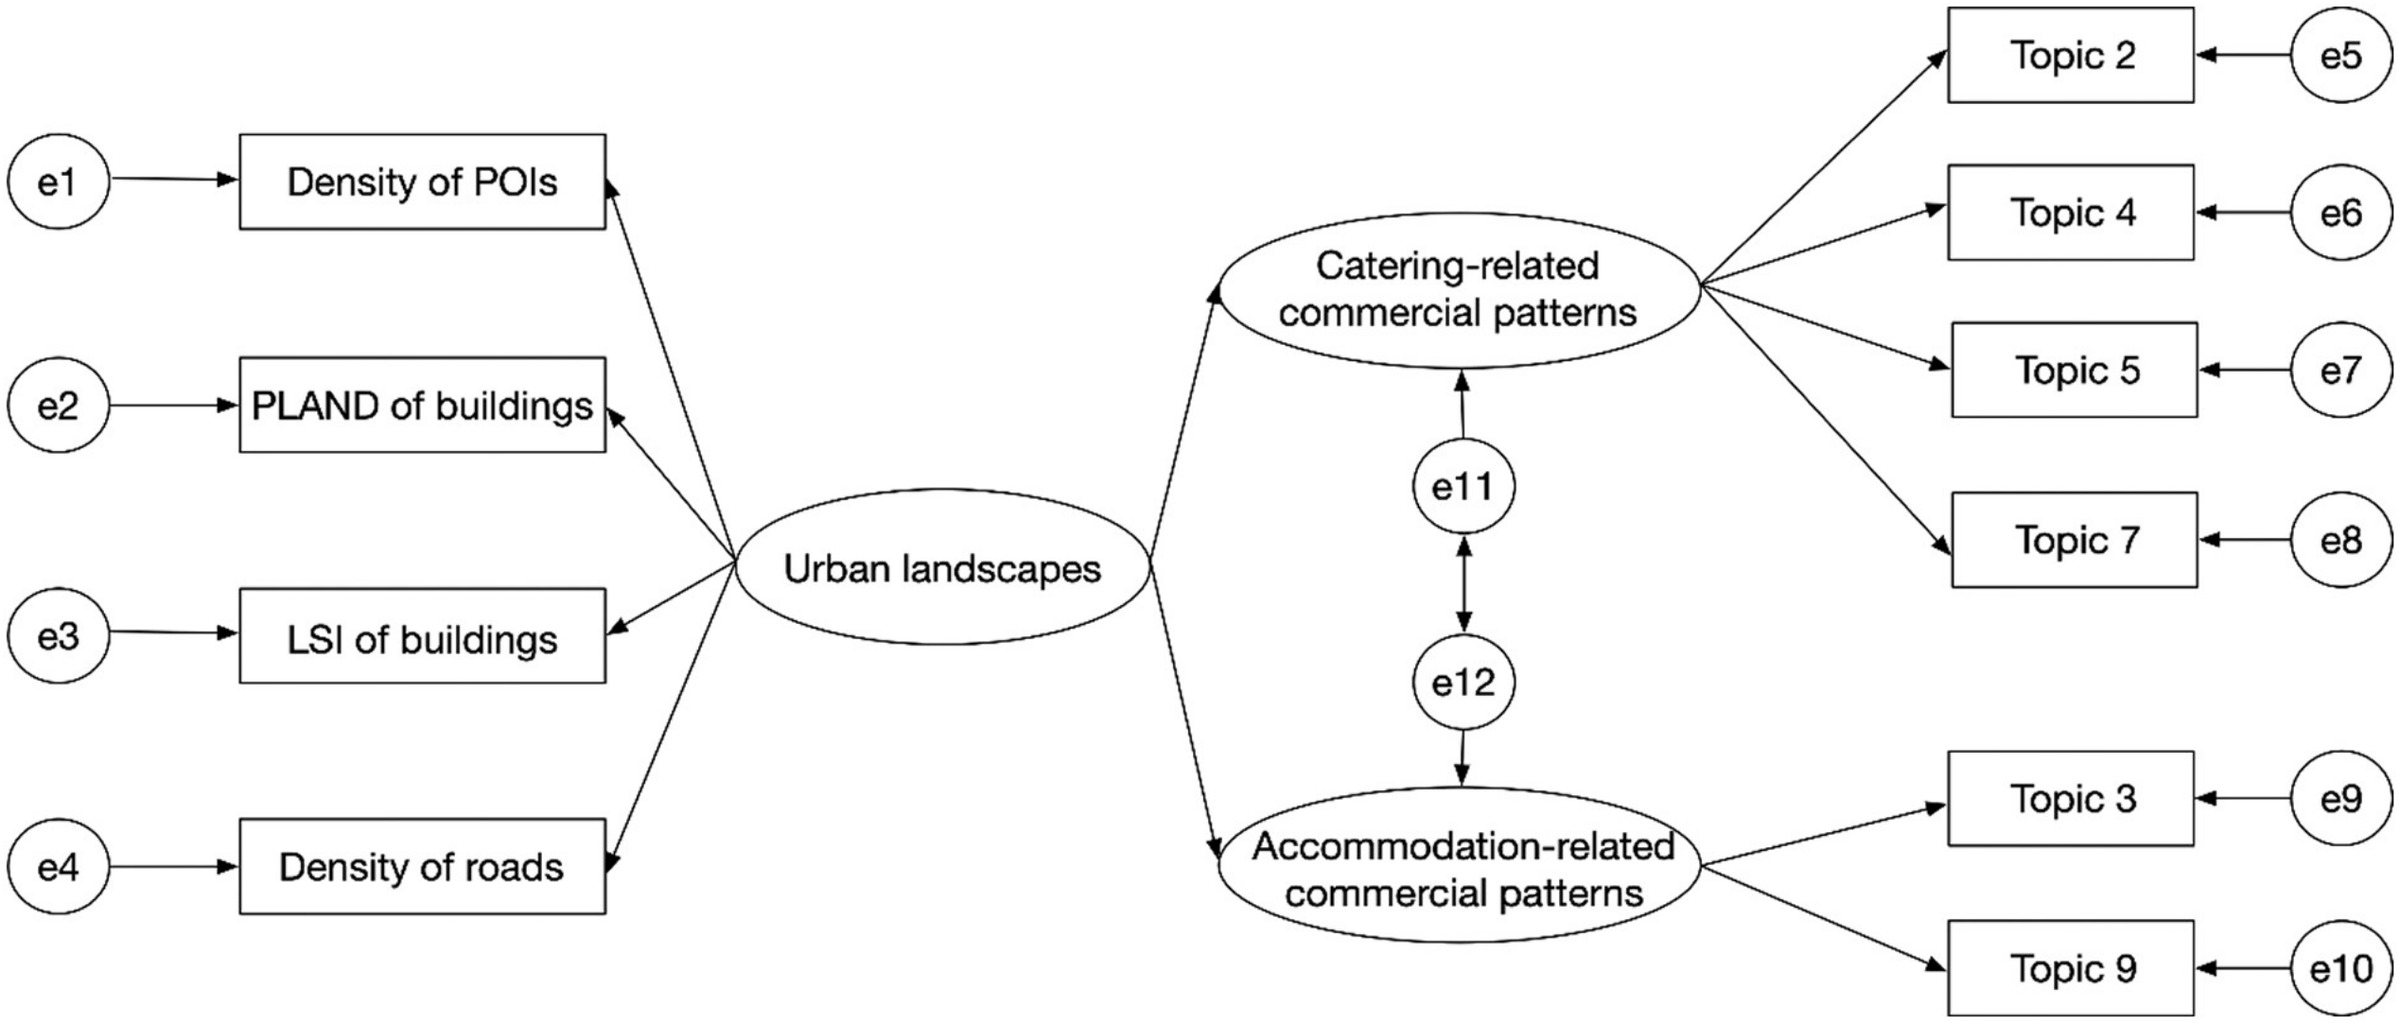
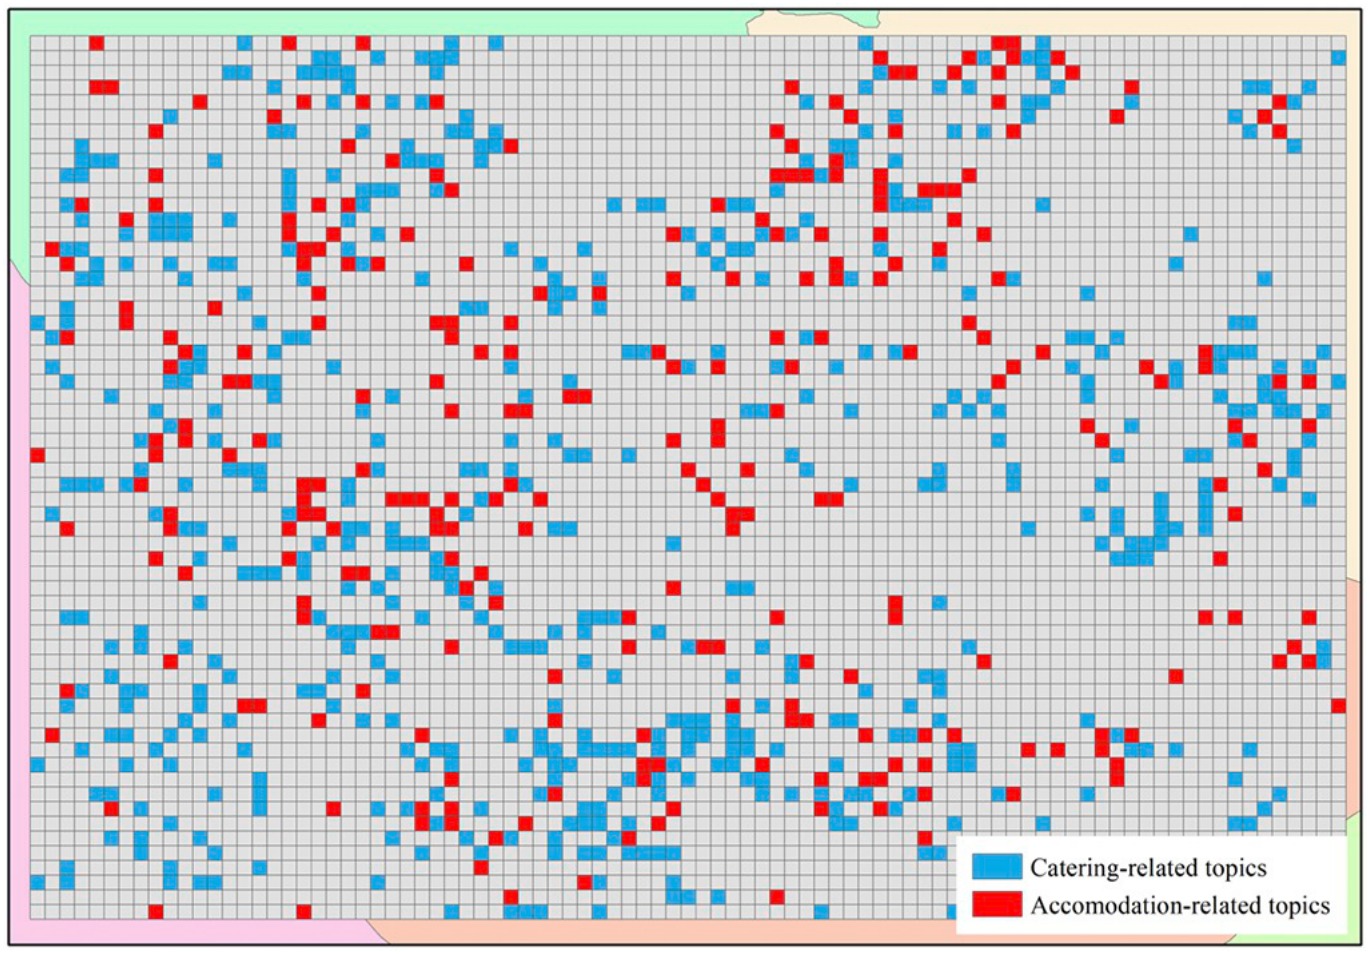
Catering-related and accommodation-related commercial patterns were extracted as latent topics from place-based reviews, then related to the surrounding urban landscape through a structural equation model in which the landscape was represented by density of points of interest, percentage of building landscape, landscape shape index of buildings, and road density. The landscape carried standardized path weights of 0.705 on catering-related patterns and 0.236 on accommodation-related patterns. Commercial development is shaped by the physical environment around it, not only by employment and economic output, which is the premise a land use plan has to act on.
Theme 3
From function to social outcome
The measures above describe places. The two studies below use them to describe people: how intensely a place is used, and how deprived the residents of it are. This is where the project meets population health.
Cities · 2019 · first author
Landscape morphology and where a city is alive
Meng, Y., & Xing, H. (2019). Exploring the relationship between landscape characteristics and urban vibrancy: a case study using morphology and review data. Cities, 95, 102389.
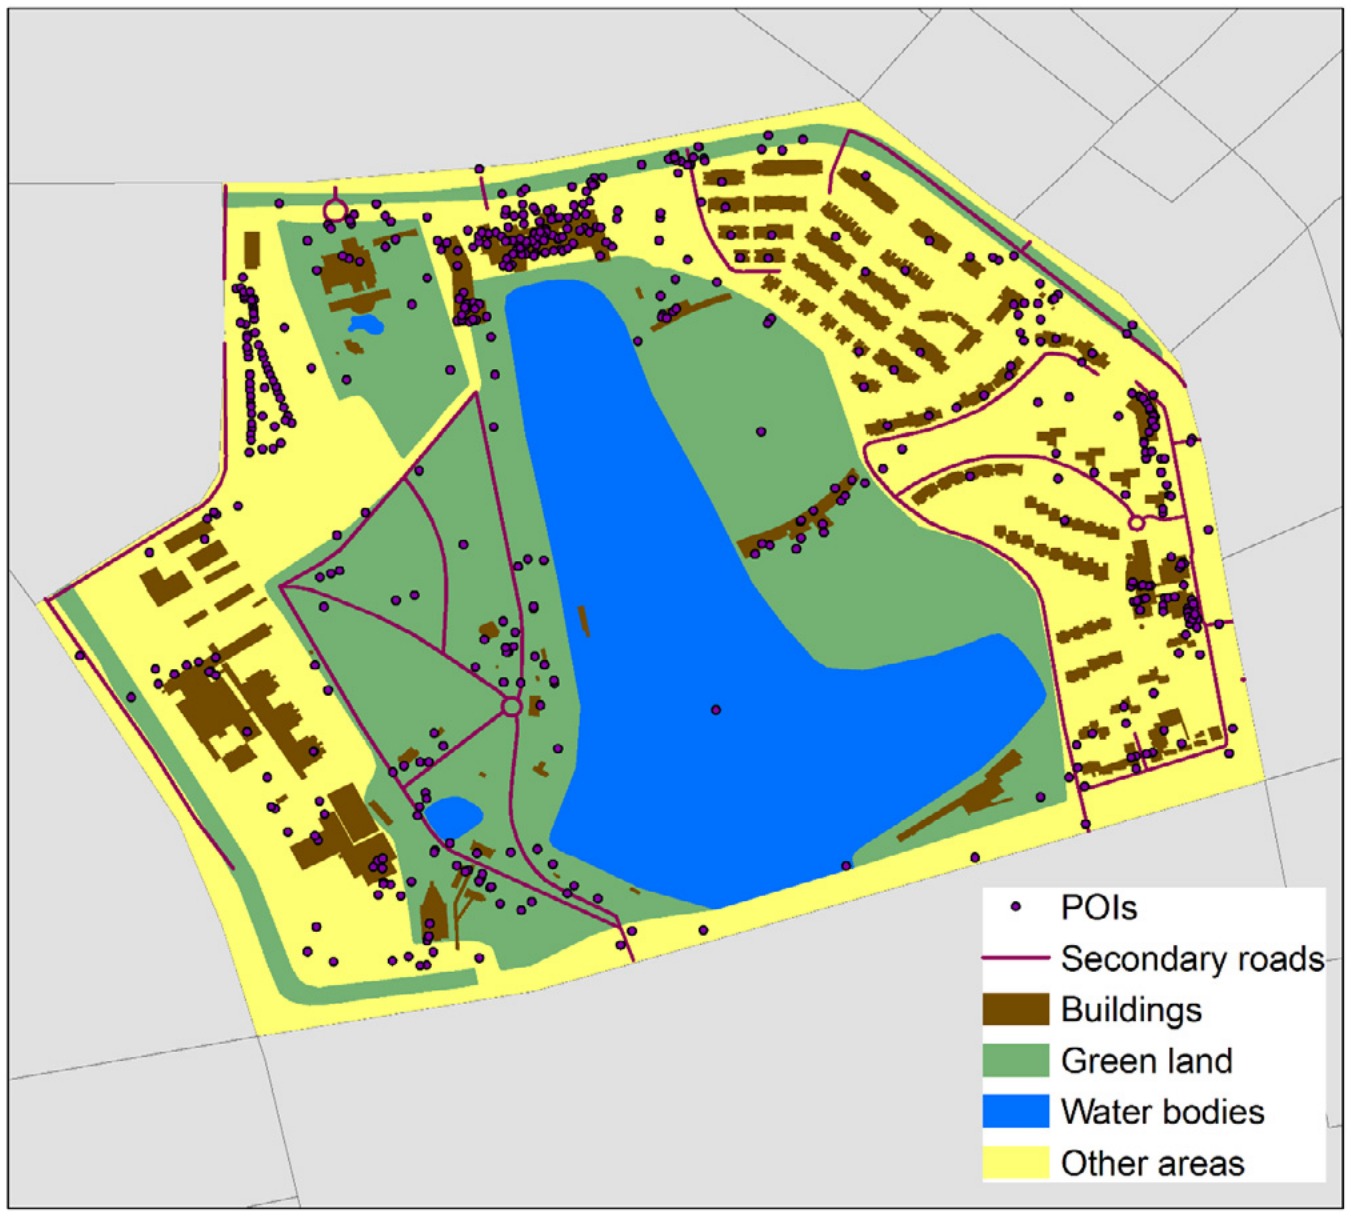
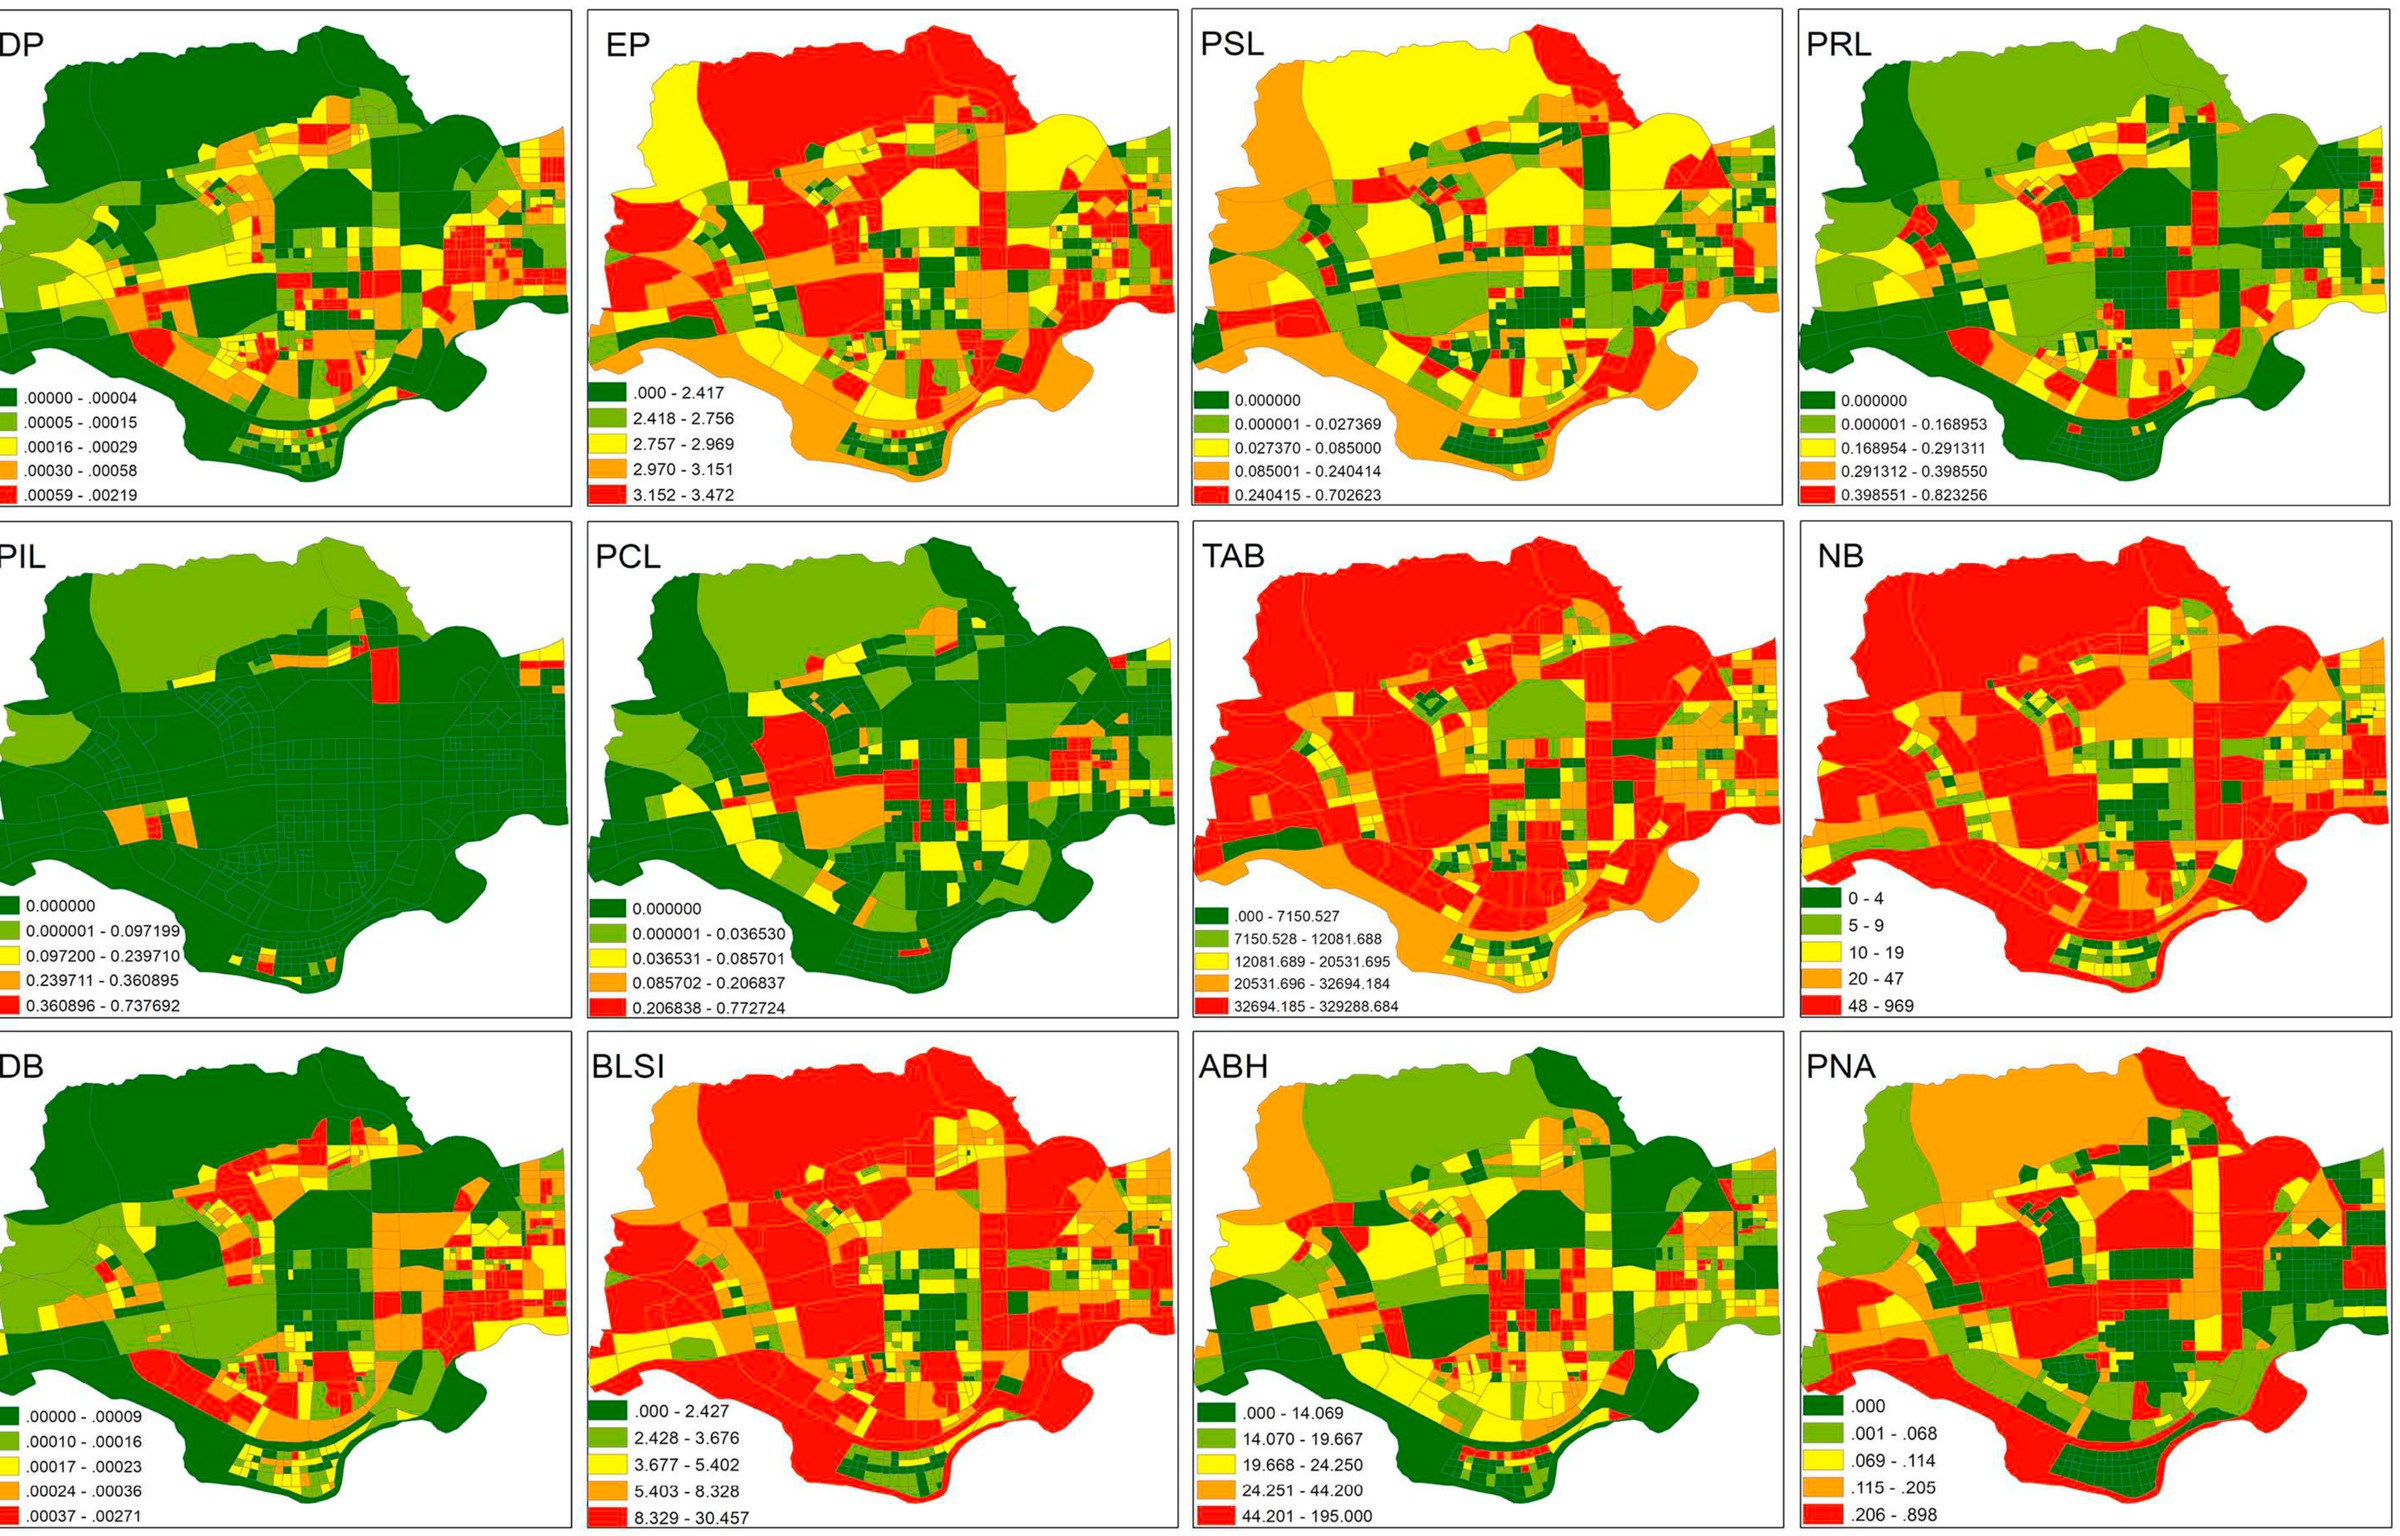
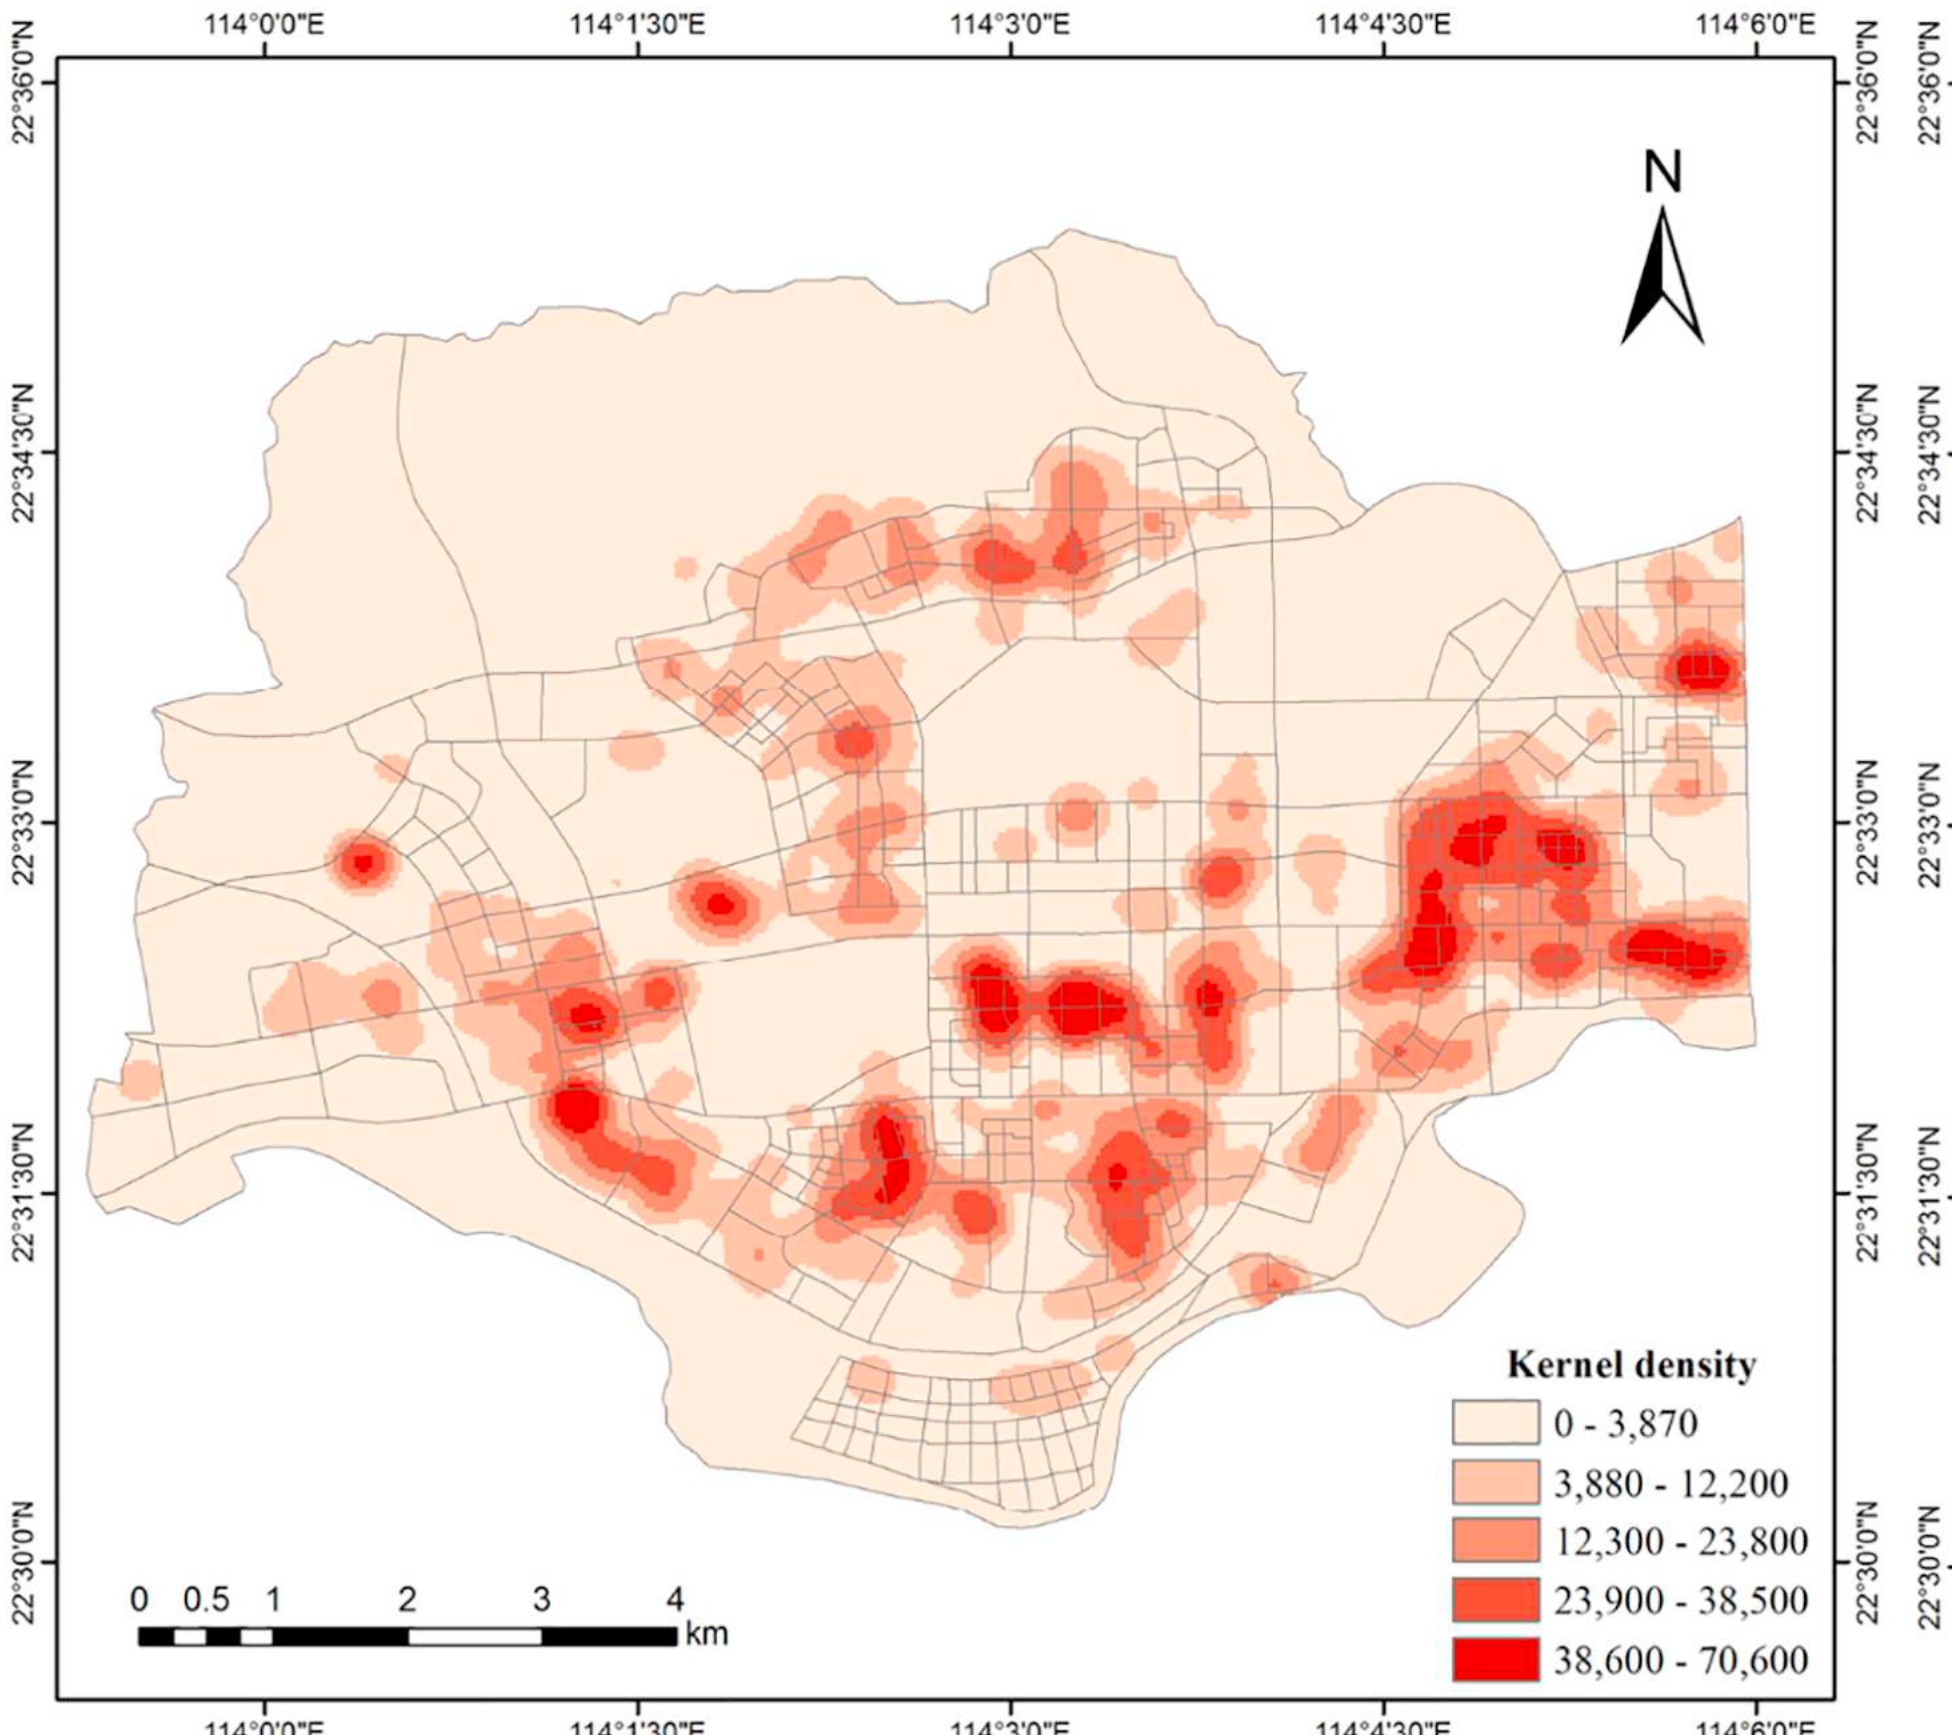
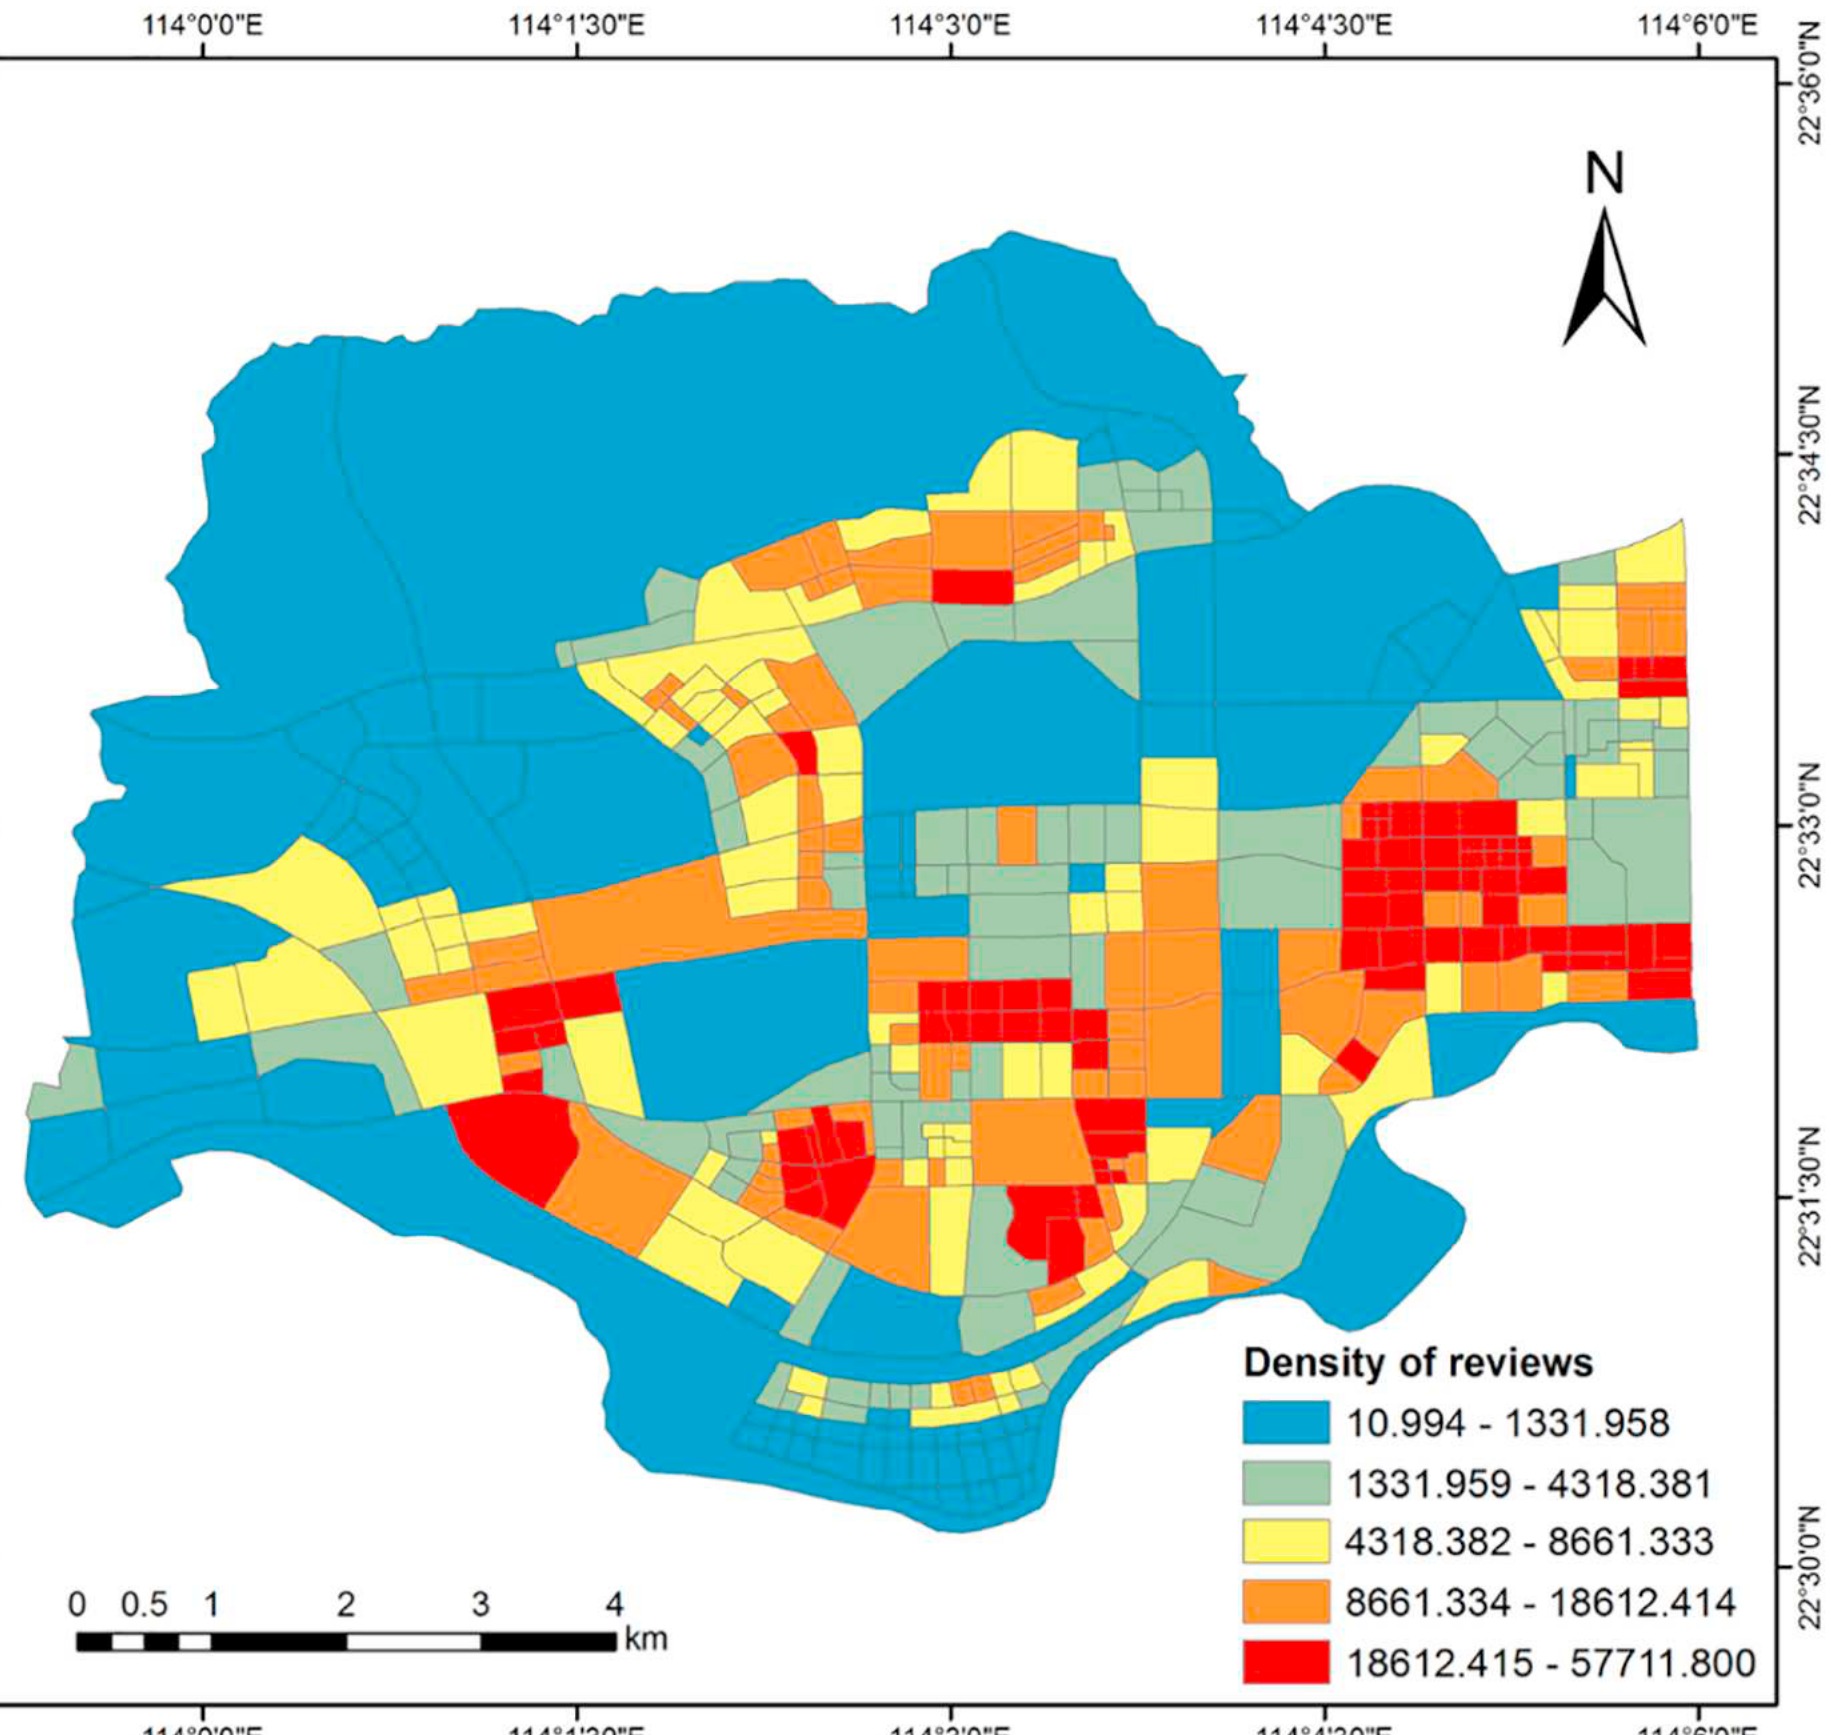
Urban vibrancy is usually approached through mixed land use, density, and accessibility. This study asked instead what the morphology of a place contributes, and described landscape characteristics at four levels: places, land use, single landscape elements, and multiple landscape elements. Vibrancy was measured by the density of place-based reviews, a behavioral trace of where people actually go rather than a demographic proxy for where they live.
Regression models reached adjusted R-squared values of 0.65, 0.65, 0.66, and 0.67 across the four levels. Vibrancy is therefore substantially explained by morphology alone, and the gain from moving to richer descriptions of the landscape is real but modest, which tells a planner that coarse morphological description is already informative.
Computers, Environment and Urban Systems · 2020 · first author
Street-level perception as a measure of deprivation
Meng, Y., Xing, H., Yuan, Y., Wong, M. S., & Fan, K. (2020). Sensing urban poverty: from the perspective of human perception-based greenery and open-space landscapes. Computers, Environment and Urban Systems, 84, 101544.
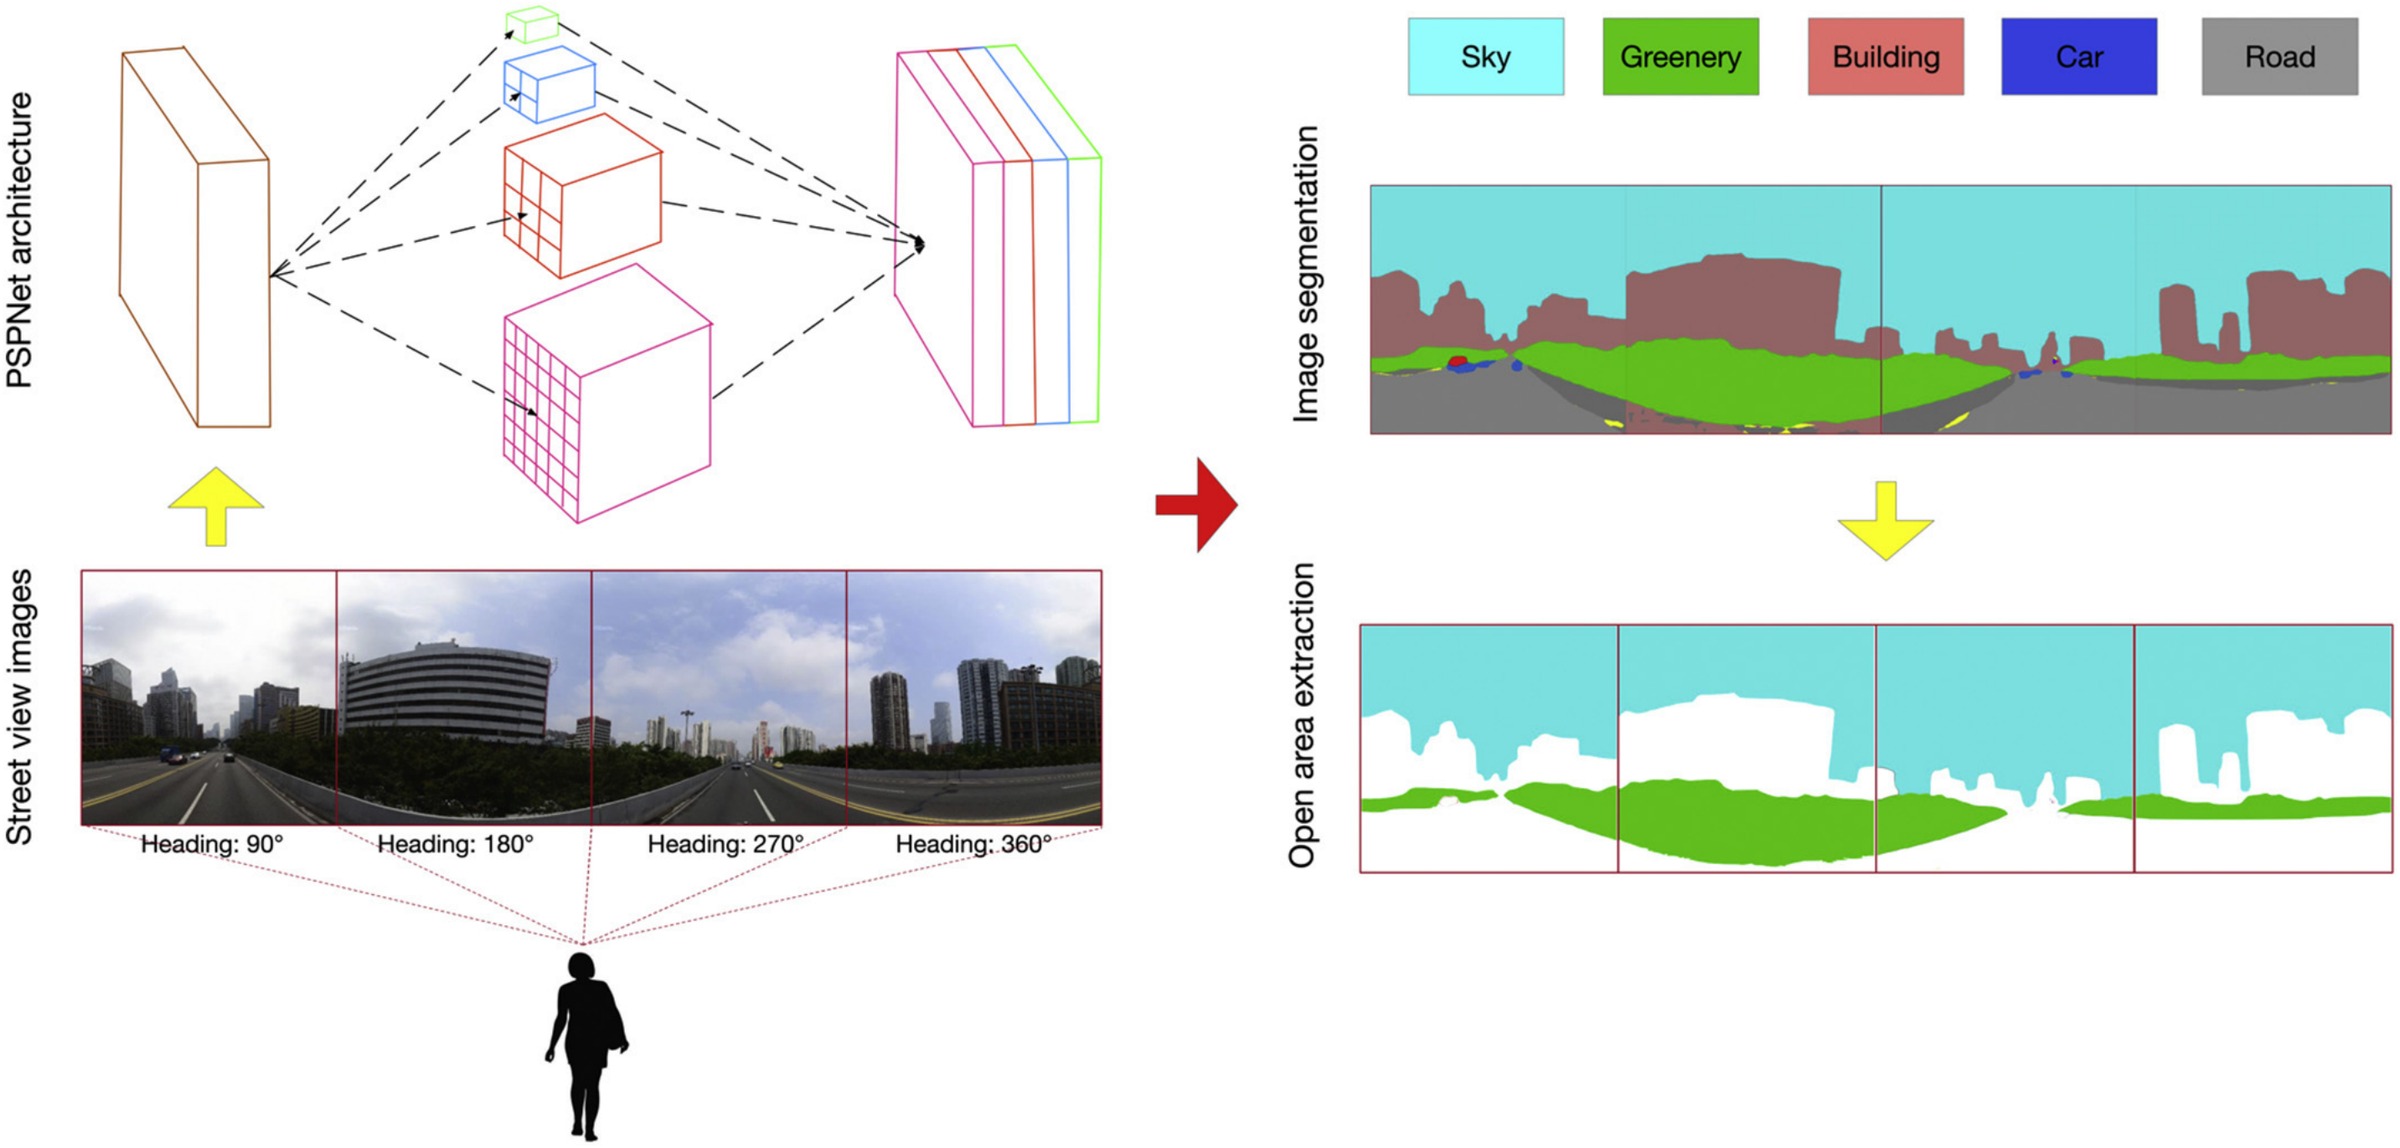
Greenery measured from above is not the greenery a resident experiences. A PSPNet semantic segmentation network was applied to street view images captured at four headings per location and labelled sky, greenery, building, car, and road. From the segmented images, percentage indicators quantified how much greenery and open space a resident perceives, and aggregation indicators quantified how unevenly that perception is distributed within an area. Occupation and inequality are treated as separate properties, because two areas with the same average greenery can differ sharply in who has access to it.
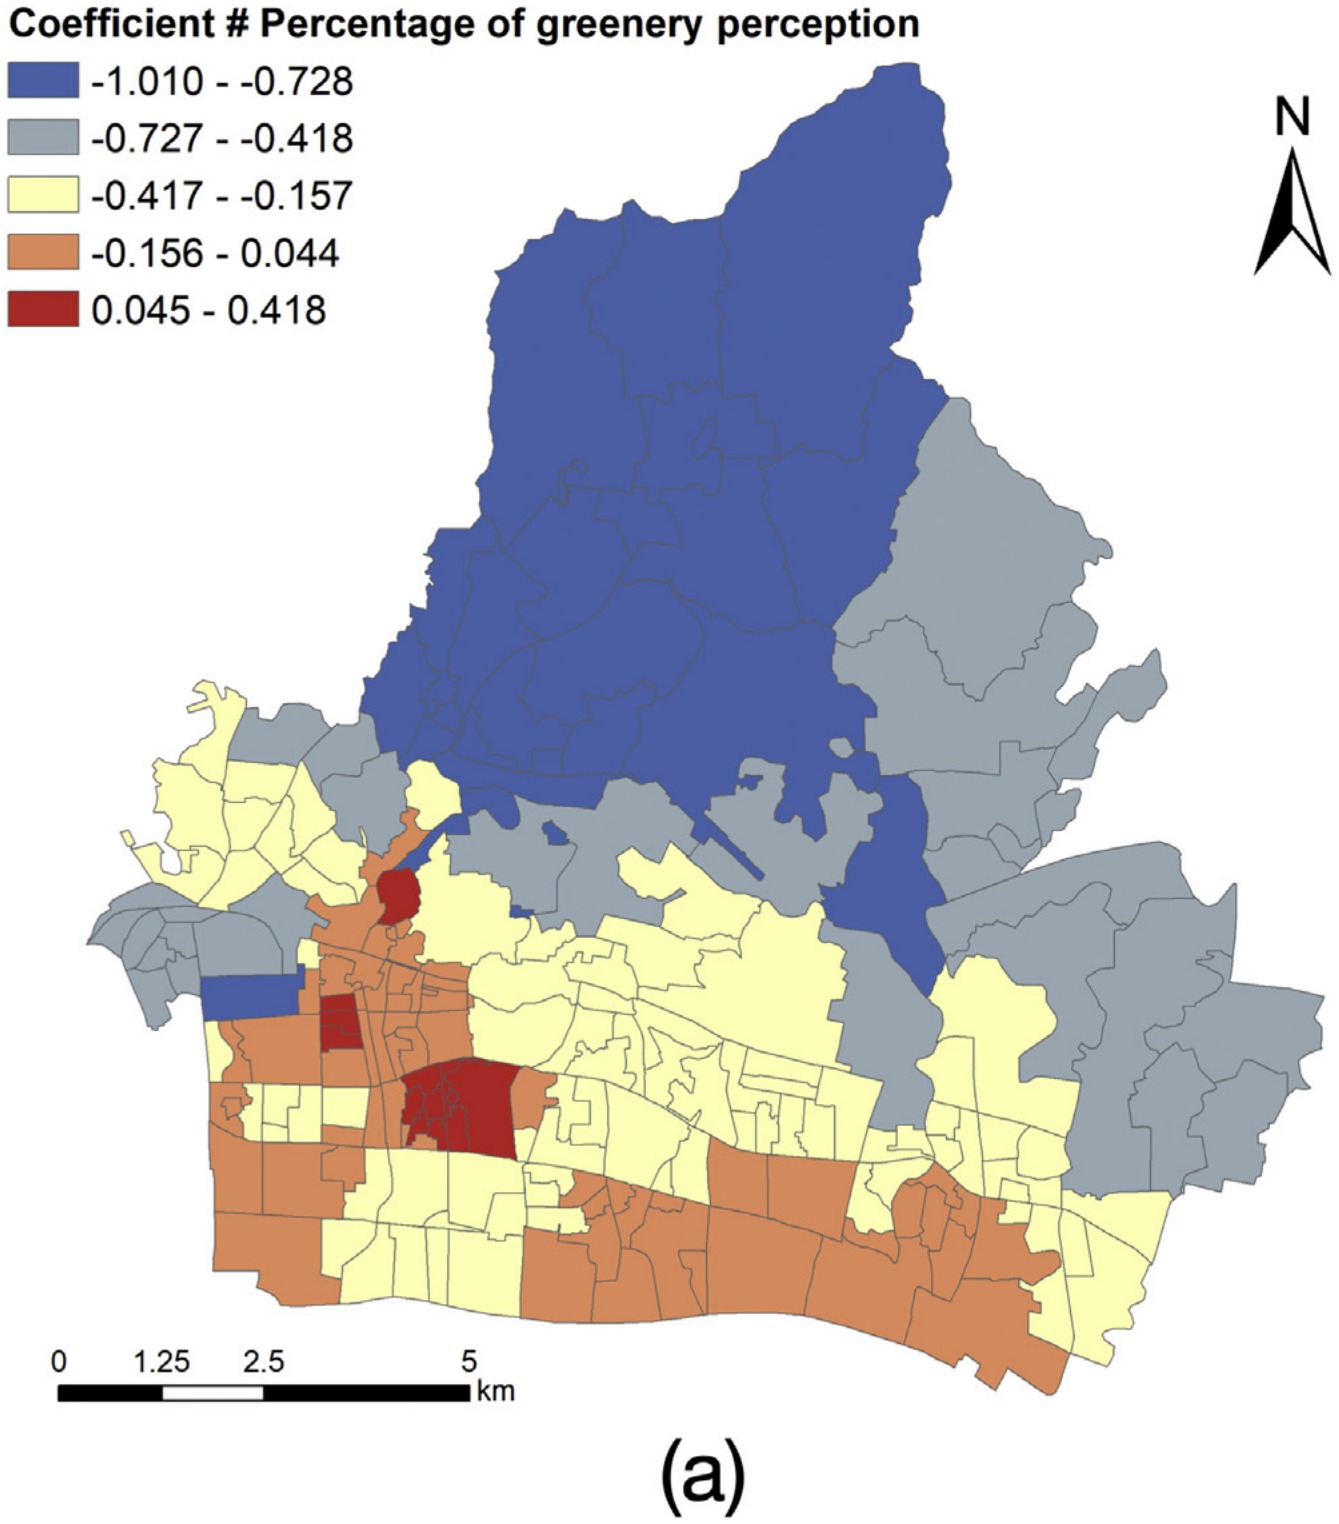
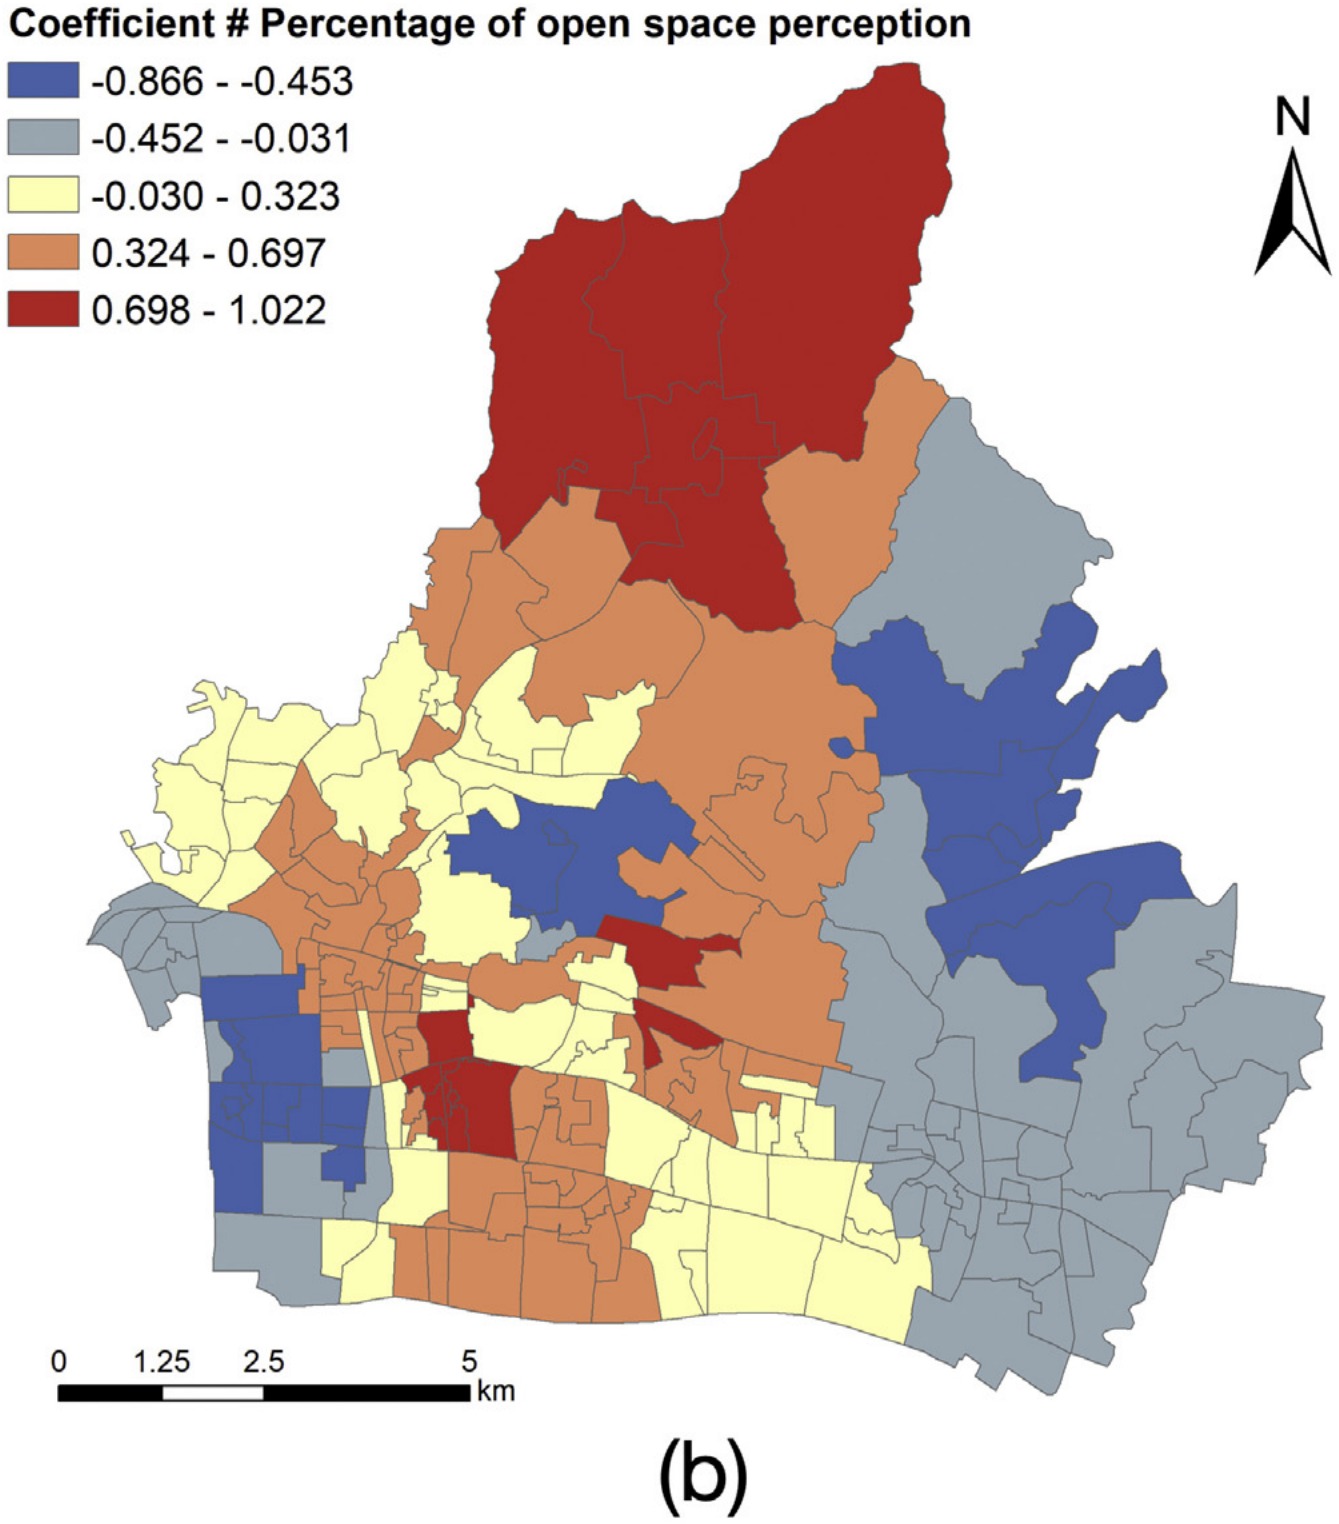
Geographically weighted regression related both indicators to the Index of Multiple Deprivation, reaching an R-squared of 0.583. The relationships proved spatially non-stationary: greenery perception is negatively associated with deprivation across most of the study area but the strength varies, and in places the sign reverses. A single citywide coefficient would therefore misstate the exposure for most neighborhoods, which is the finding that carries directly into the health projects.
Continuity
Where this leads
This project supplies the social half of the exposure layer. The parcel-level function, vibrancy, and deprivation measures built here are what allow a health analysis to distinguish neighborhoods that a land cover map treats as identical. The street view segmentation pipeline is the same one later applied to the food environment in the cognitive health studies, and the finding that place effects are spatially non-stationary is what motivates the local rather than global models used in the COVID-19 mortality work. Measuring urban function is not the endpoint: it is what makes a place-based exposure specific enough to be worth estimating.
Summary
Selected papers
2020 Meng, Y., Xing, H., Yuan, Y., Wong, M. S., & Fan, K. Sensing urban poverty: from the perspective of human perception-based greenery and open-space landscapes. Computers, Environment and Urban Systems, 84, 101544.first author
Street-level greenery and open space, segmented by PSPNet, relate to deprivation with an R-squared of 0.583, and the relationship is spatially non-stationary.
2020 Xing, H., & Meng, Y.* Revealing deep semantic commercial patterns: insights from urban landscape depiction. Computers, Environment and Urban Systems, 79, 101404.corresponding
Urban landscape carries standardized path weights of 0.705 on catering-related and 0.236 on accommodation-related commercial patterns.
2020 Xing, H., & Meng, Y.* Measuring urban landscapes for urban function classification using spatial metrics. Ecological Indicators, 108, 105722.corresponding
Spatial metrics of buildings, green land, and water classify urban function at 0.813 accuracy, with public and service functions the hardest class.
2019 Meng, Y., & Xing, H. Exploring the relationship between landscape characteristics and urban vibrancy: a case study using morphology and review data. Cities, 95, 102389.first author
Morphology alone explains urban vibrancy with adjusted R-squared of 0.65 to 0.67 across four levels of landscape description.
2018 Xing, H., & Meng, Y.* Integrating landscape metrics and socioeconomic features for urban functional region classification. Computers, Environment and Urban Systems, 72, 134–145.corresponding
Landscape metrics and socioeconomic features each reach 0.664 accuracy alone and 0.818 together, so physical form and social content are complementary rather than substitutable.
2018 Xing, H., Meng, Y.*, & Shi, Y. A dynamic human activity-driven model for mixed land use evaluation using social media data. Transactions in GIS, 22(5), 1130–1151.corresponding
Dynamic features built from the timing of social media activity correlate 0.750 with labelled land use, against 0.119 for semantic features alone.