Sensing Place: Mapping the Physical Environment
Methods for measuring land cover from volunteered geographic information, and for validating, updating, and explaining the global products on which environmental exposure research depends.
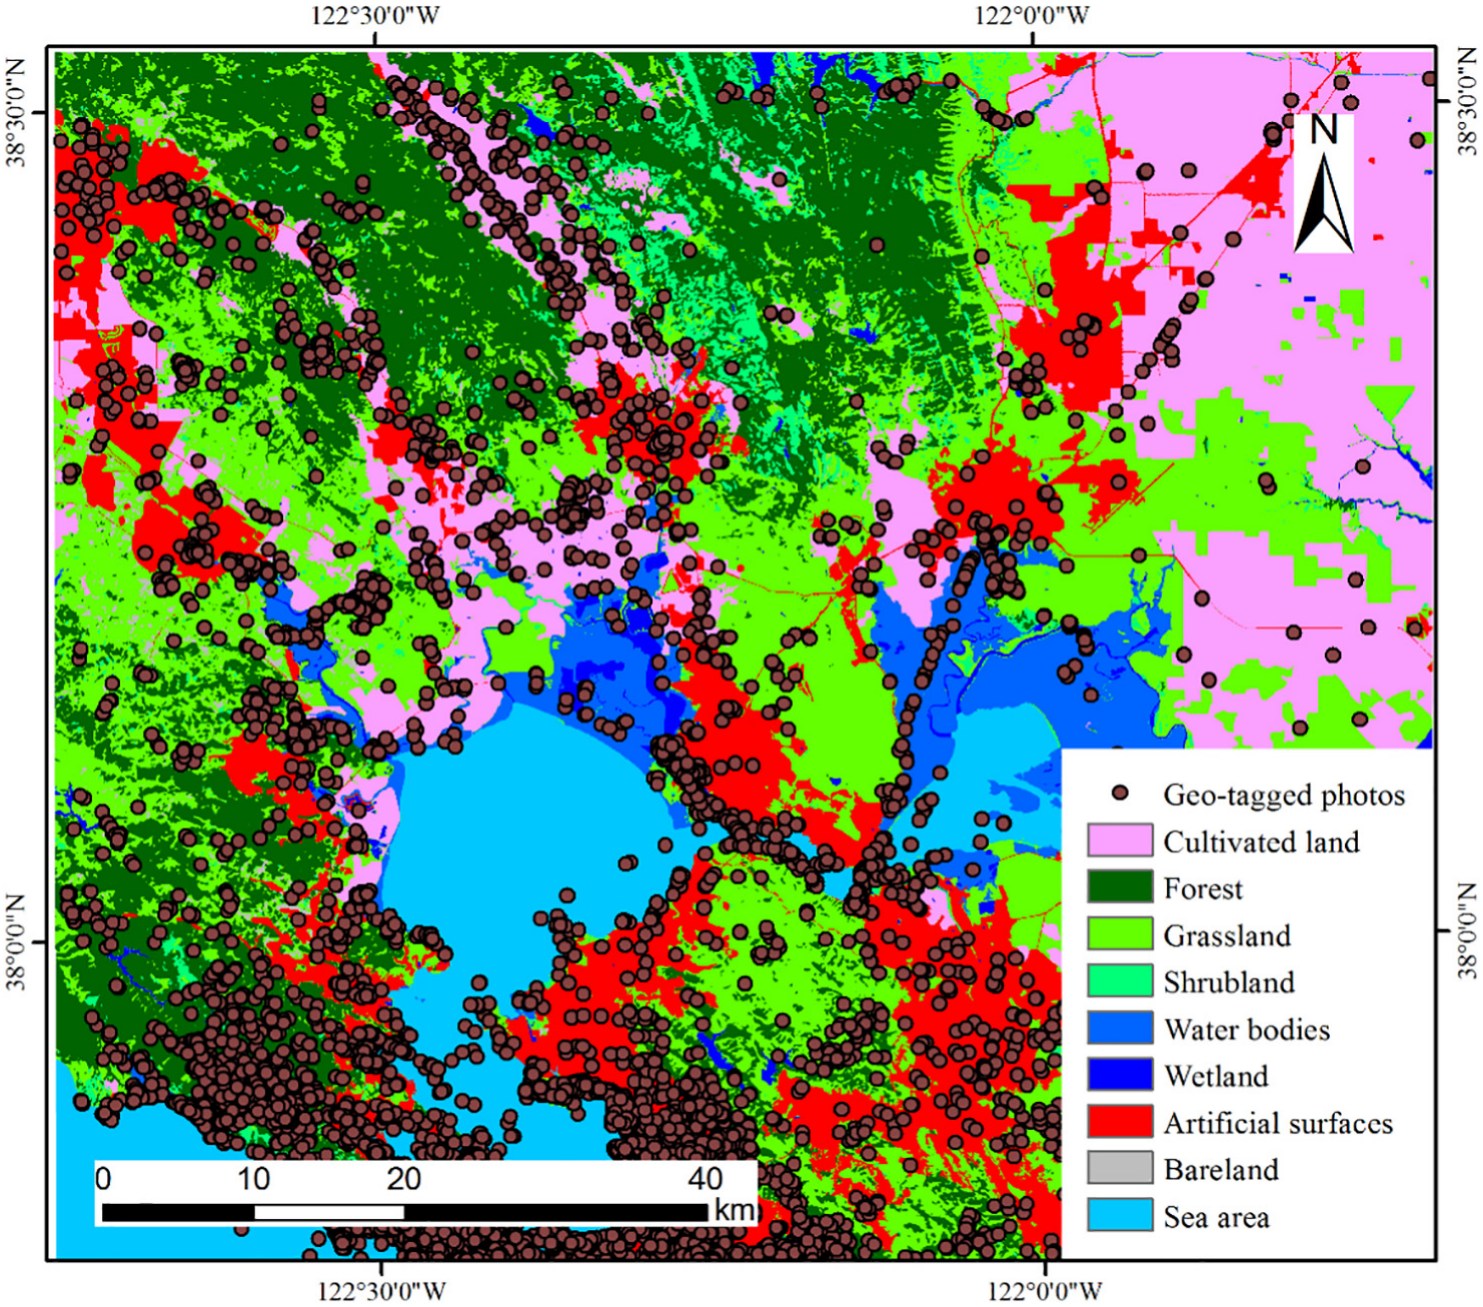
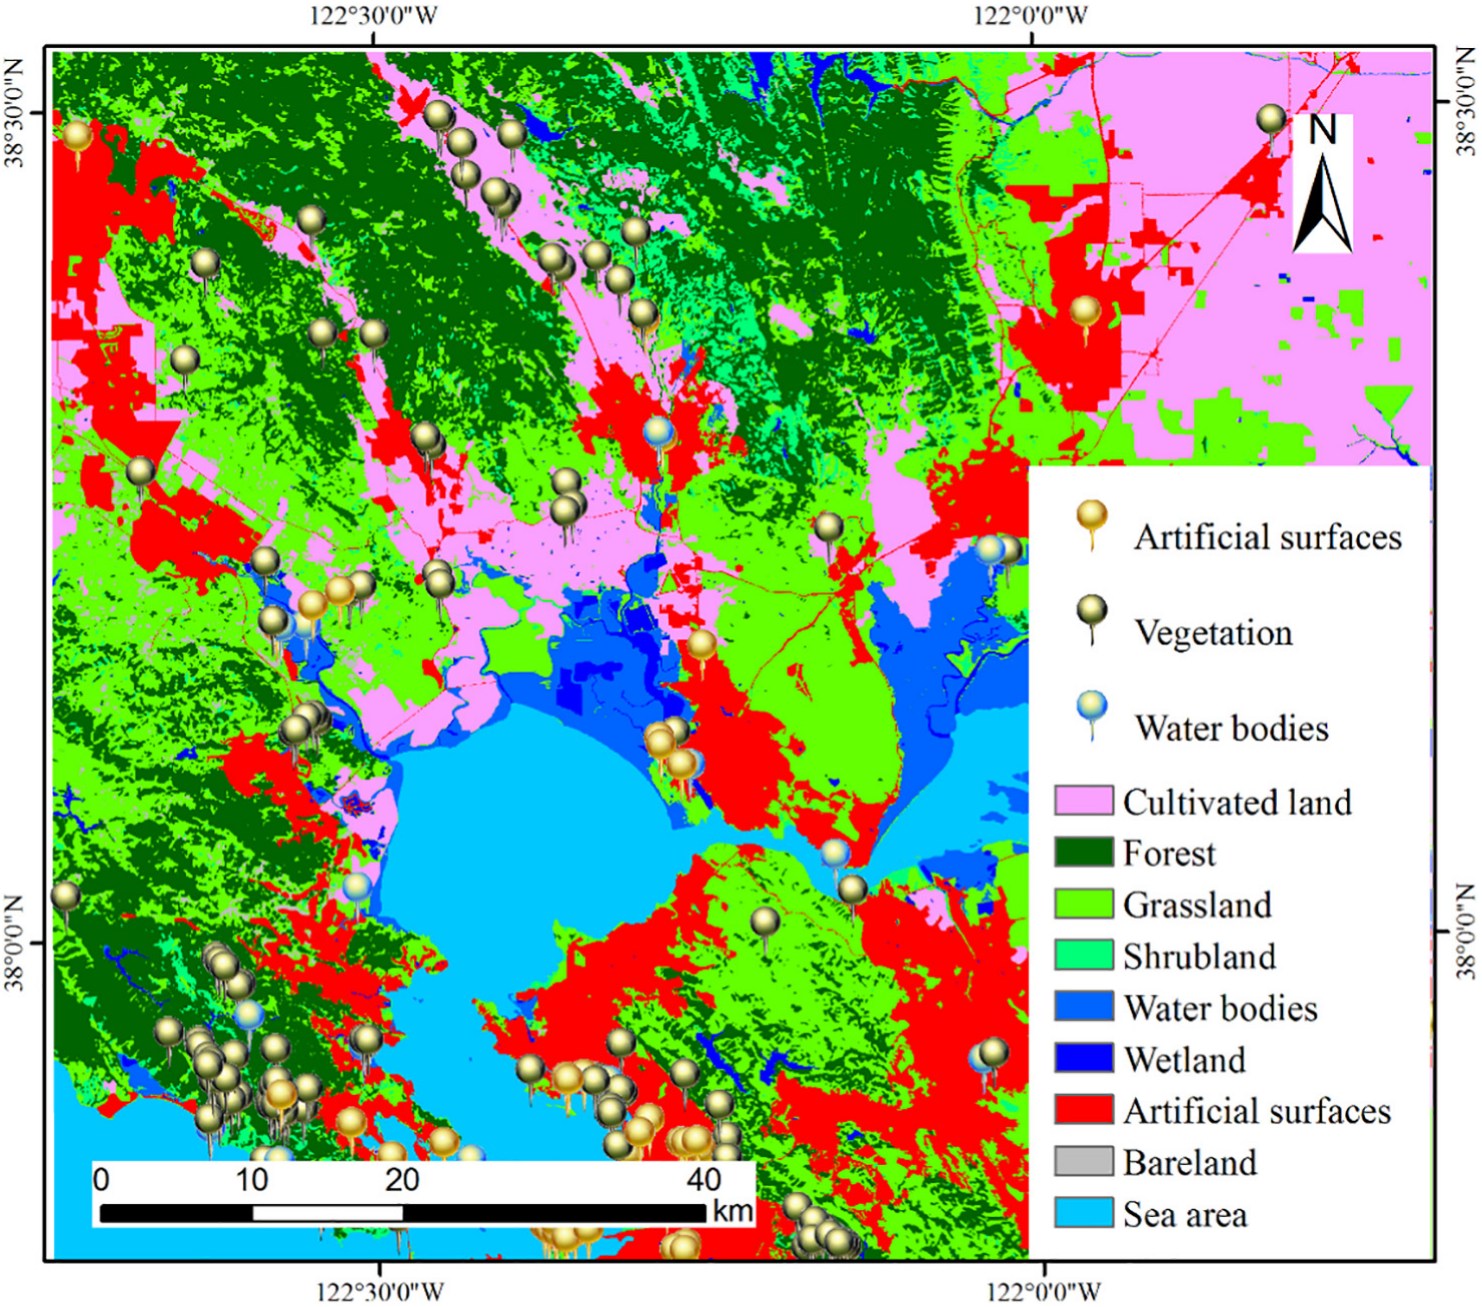
Both panels from Xing, Meng et al., ISPRS Journal of Photogrammetry and Remote Sensing (2018).
Research question
Can volunteered data carry the exposure layer?
Global land cover products such as GlobeLand30 underpin the assignment of environmental exposures in population health research. Three properties limit that use. Releases are separated by several years, so the map need not correspond to the period over which exposure accrues. Validation depends on expert photo-interpretation, which constrains the number of reference samples that can realistically be collected. And thematic classes are defined for global consistency rather than for the distinctions that matter within a city.
Volunteered geographic information offers a possible remedy. Geotagged photographs and points of interest are generated continuously, are spatially dense in populated areas, and carry semantic labels. The five studies collected here establish what such data can and cannot do: validate an existing product, classify land cover independently of imagery, detect change between official releases, and support statistical explanation of land use transformation.
Approach
Three moves across five studies
Collect
Photographs from Flickr and points of interest from online map services and social media platforms: data already in existence, refreshed continuously, at no acquisition cost.
Interpret
Convolutional neural networks assign a land cover class to a photograph. Density-based clustering and topic models aggregate scattered points into coherent regions, and hull fitting supplies their boundaries.
Assess and explain
Results are tested against the official product cell by cell, changes are detected as class transitions, and hierarchical models attribute transformation to its spatial scale.
Theme 1
Validating global land cover products
Accuracy assessment is the bottleneck in global land cover mapping: reference samples must be interpreted individually, and the cost of doing so limits how many can be collected. Both studies below replace part of that interpretation with an automated classifier applied to volunteered data.
ISPRS Journal of Photogrammetry and Remote Sensing · 2018 · corresponding author
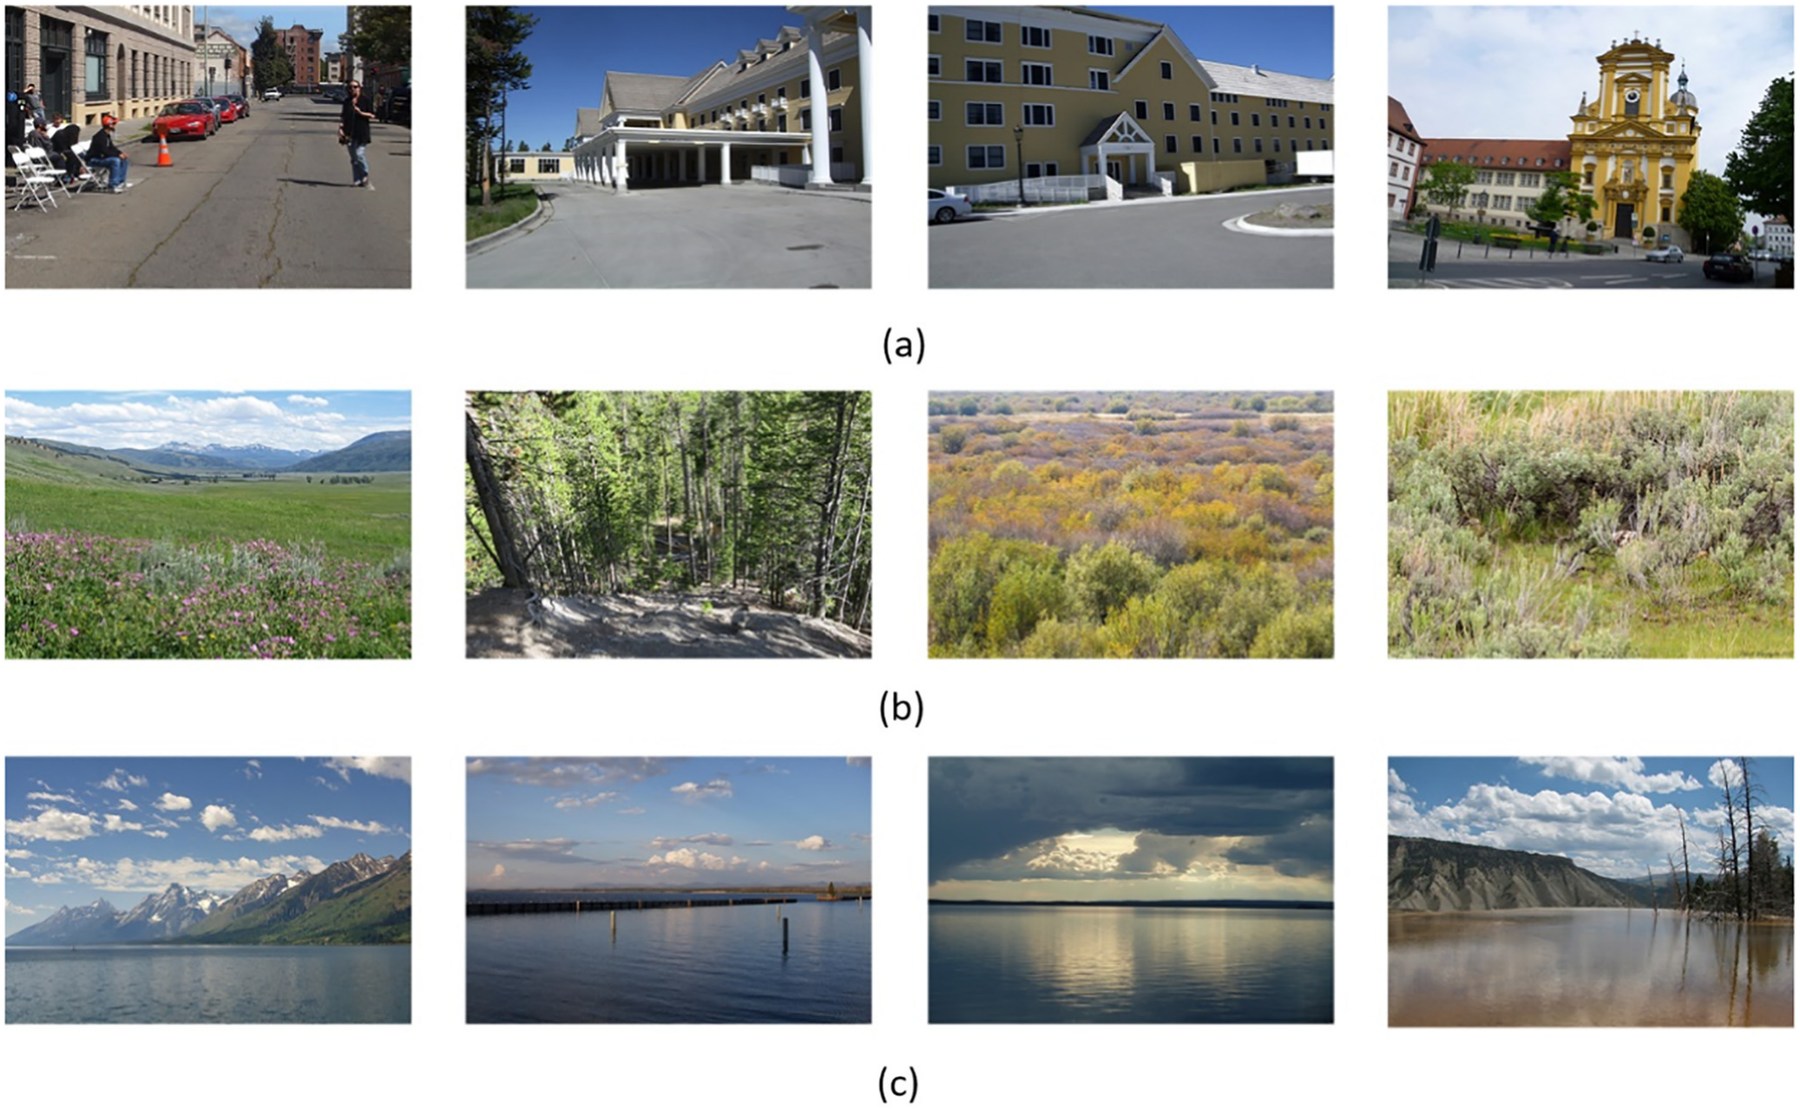
Geotagged photographs as reference samples, classified by deep learning
Xing, H., Meng, Y.* (corresponding author), Wang, Z., Fan, K., & Hou, D. (2018). Exploring geo-tagged photos for land cover validation with deep learning. ISPRS Journal of Photogrammetry and Remote Sensing, 141, 237–251.
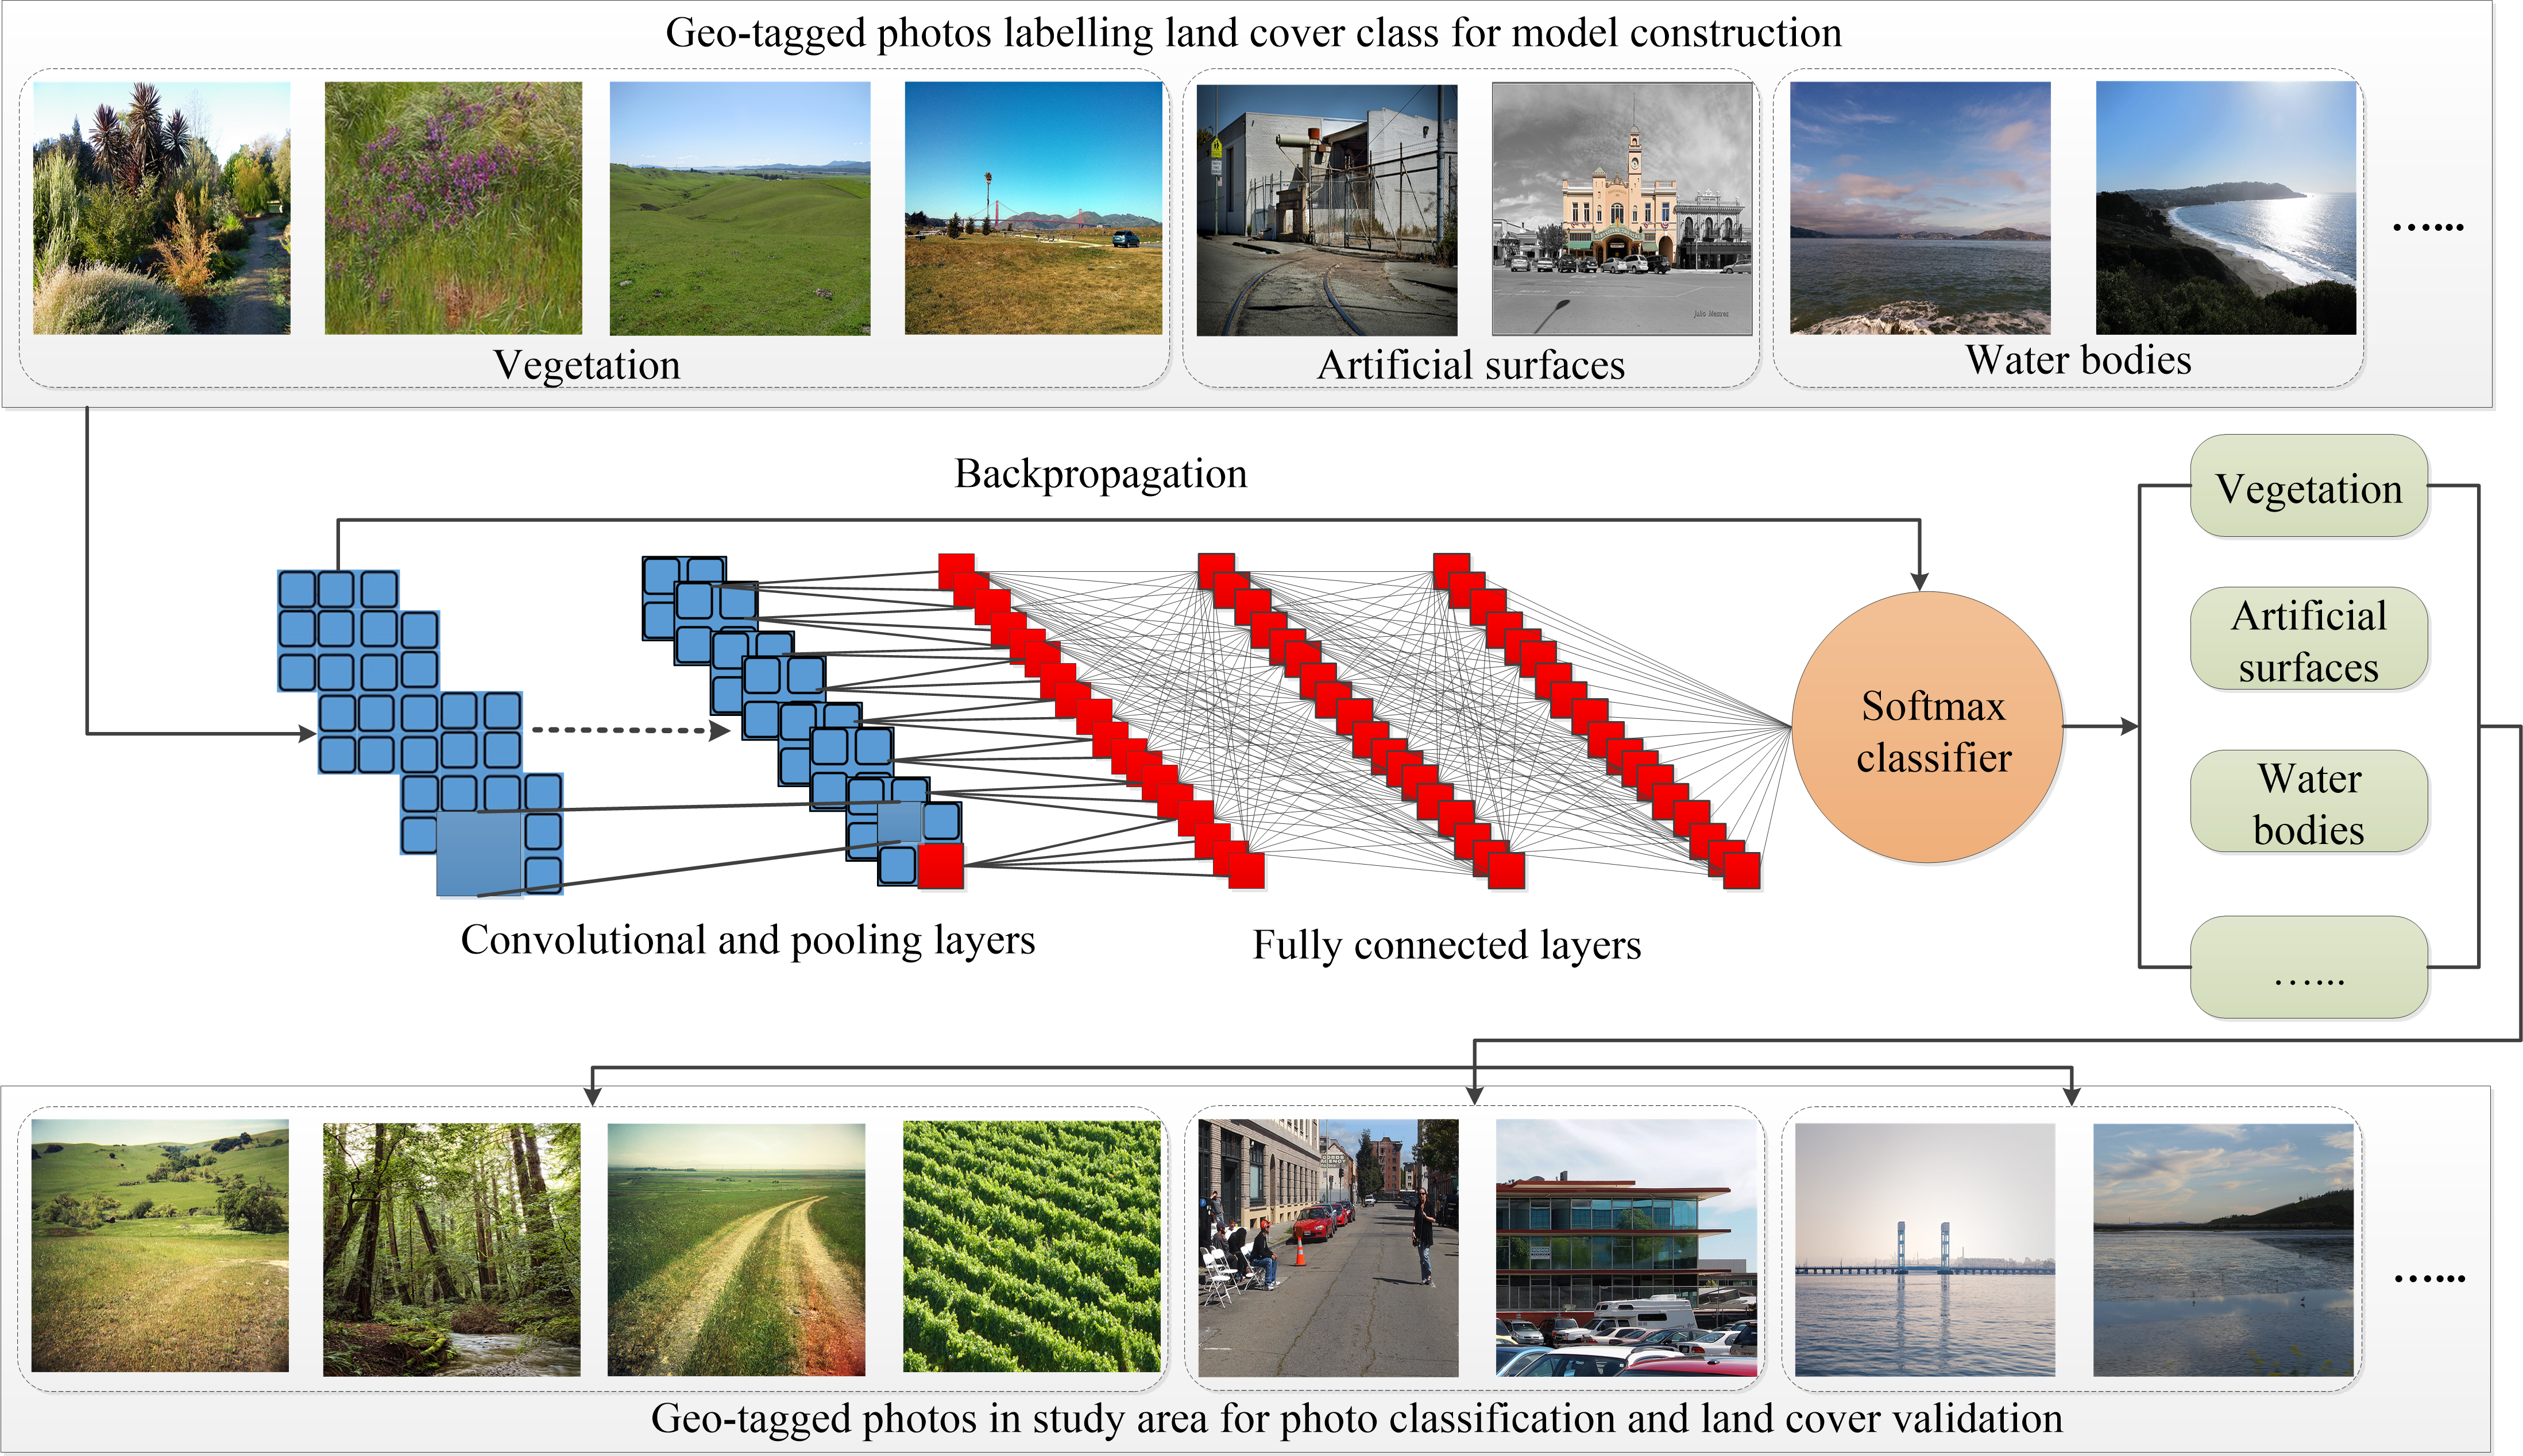
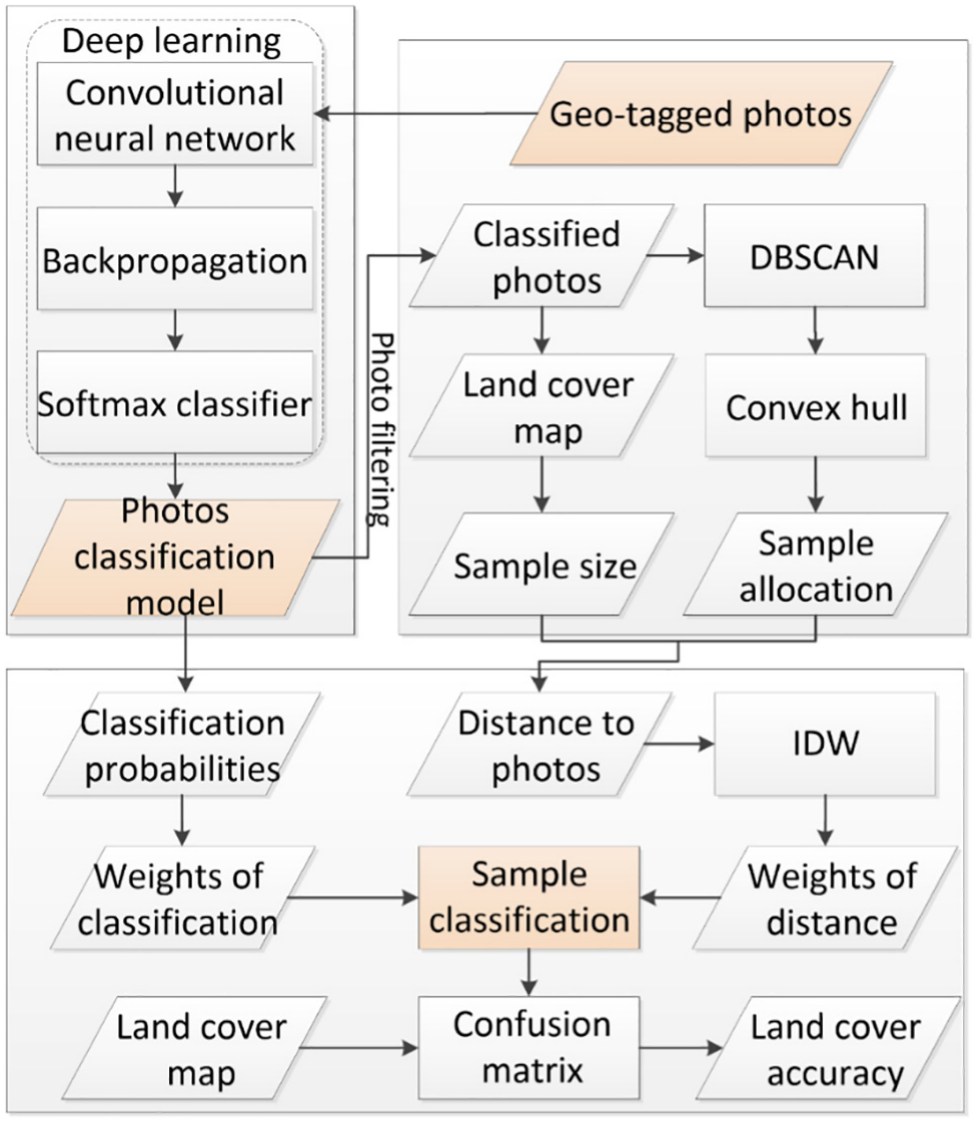
A VGG-16 network was trained on 10,345 globally distributed photographs and applied to 22,022 photographs within the study area, yielding land cover class probabilities for each. A sample selection procedure then combined those probabilities with an inverse-distance weighting of the photograph's proximity to the candidate sample, so that confident and well-located photographs contribute more to the reference set.
The contribution is a validation workflow in which sample interpretation is automated end to end while retaining an explicit account of sample reliability. The approach makes accuracy assessment tractable at scales where expert interpretation is not.
International Journal of Remote Sensing · 2017 · co-first author
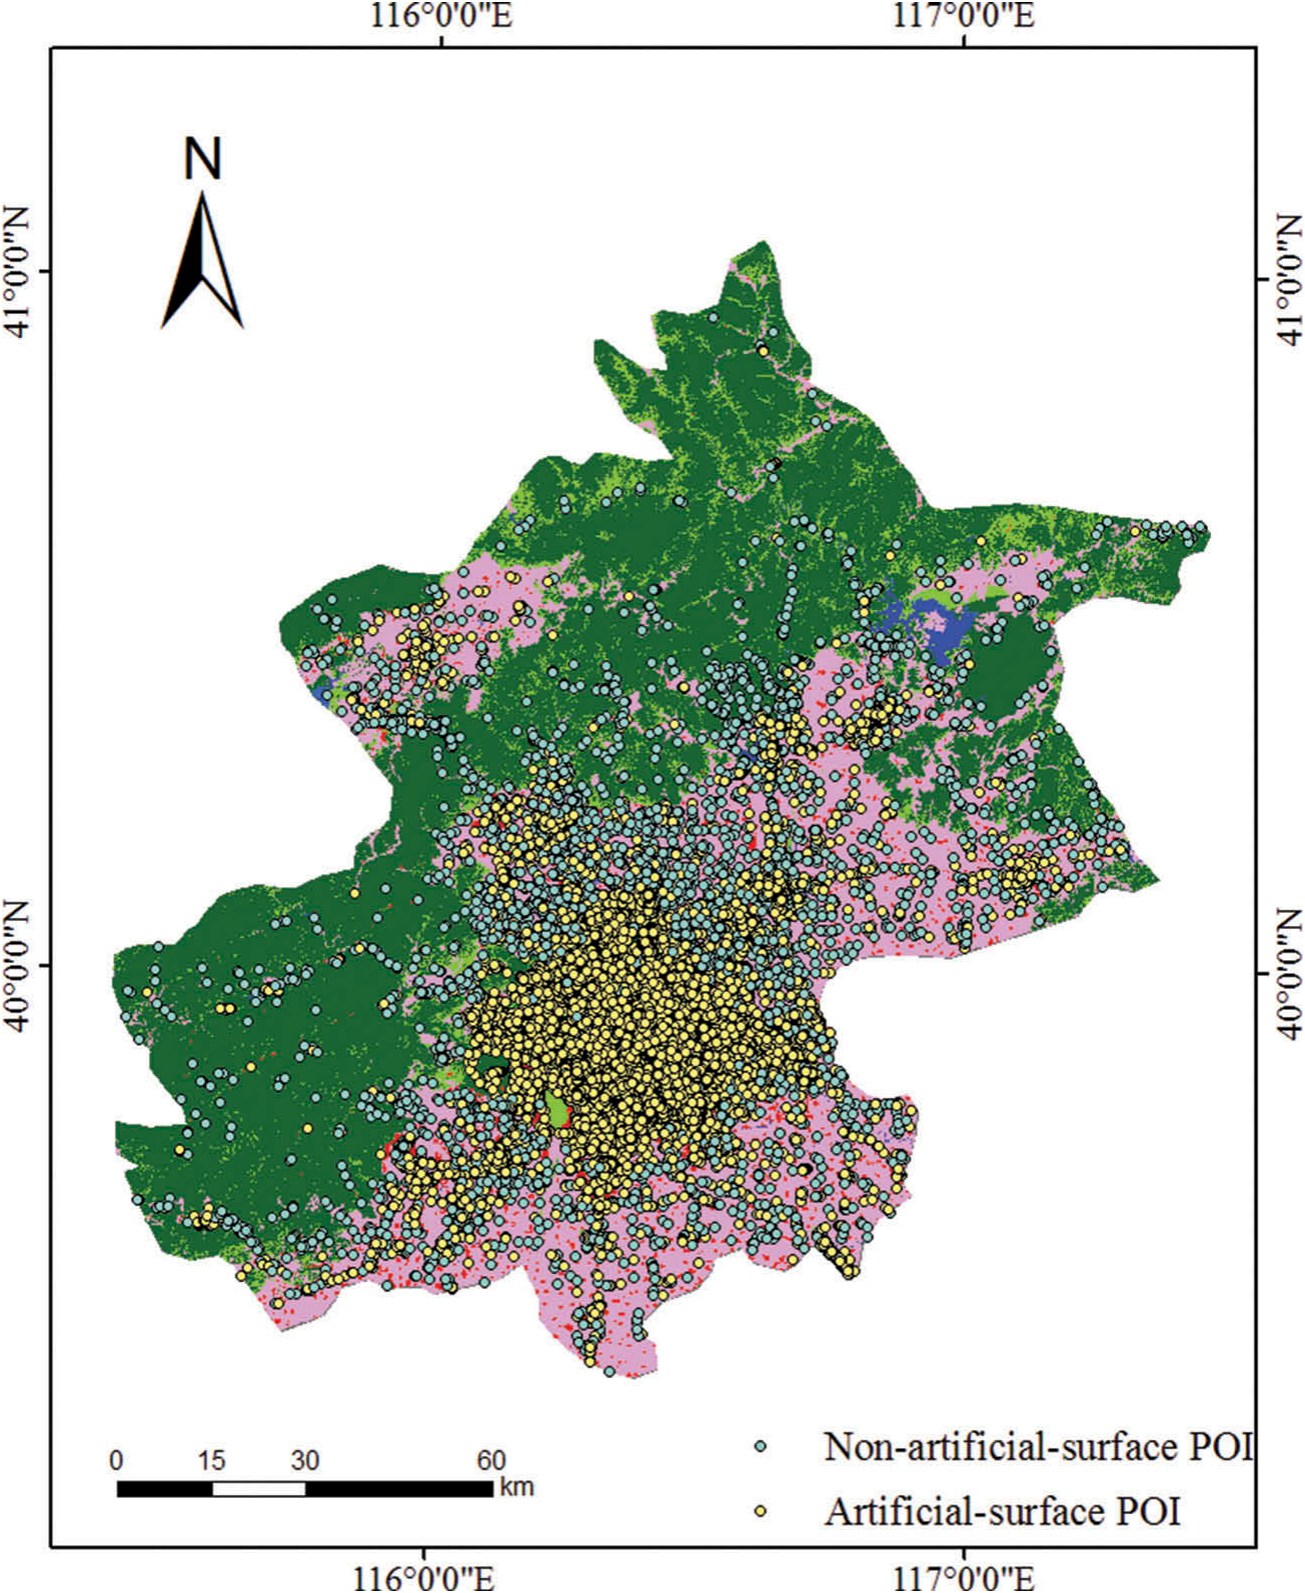
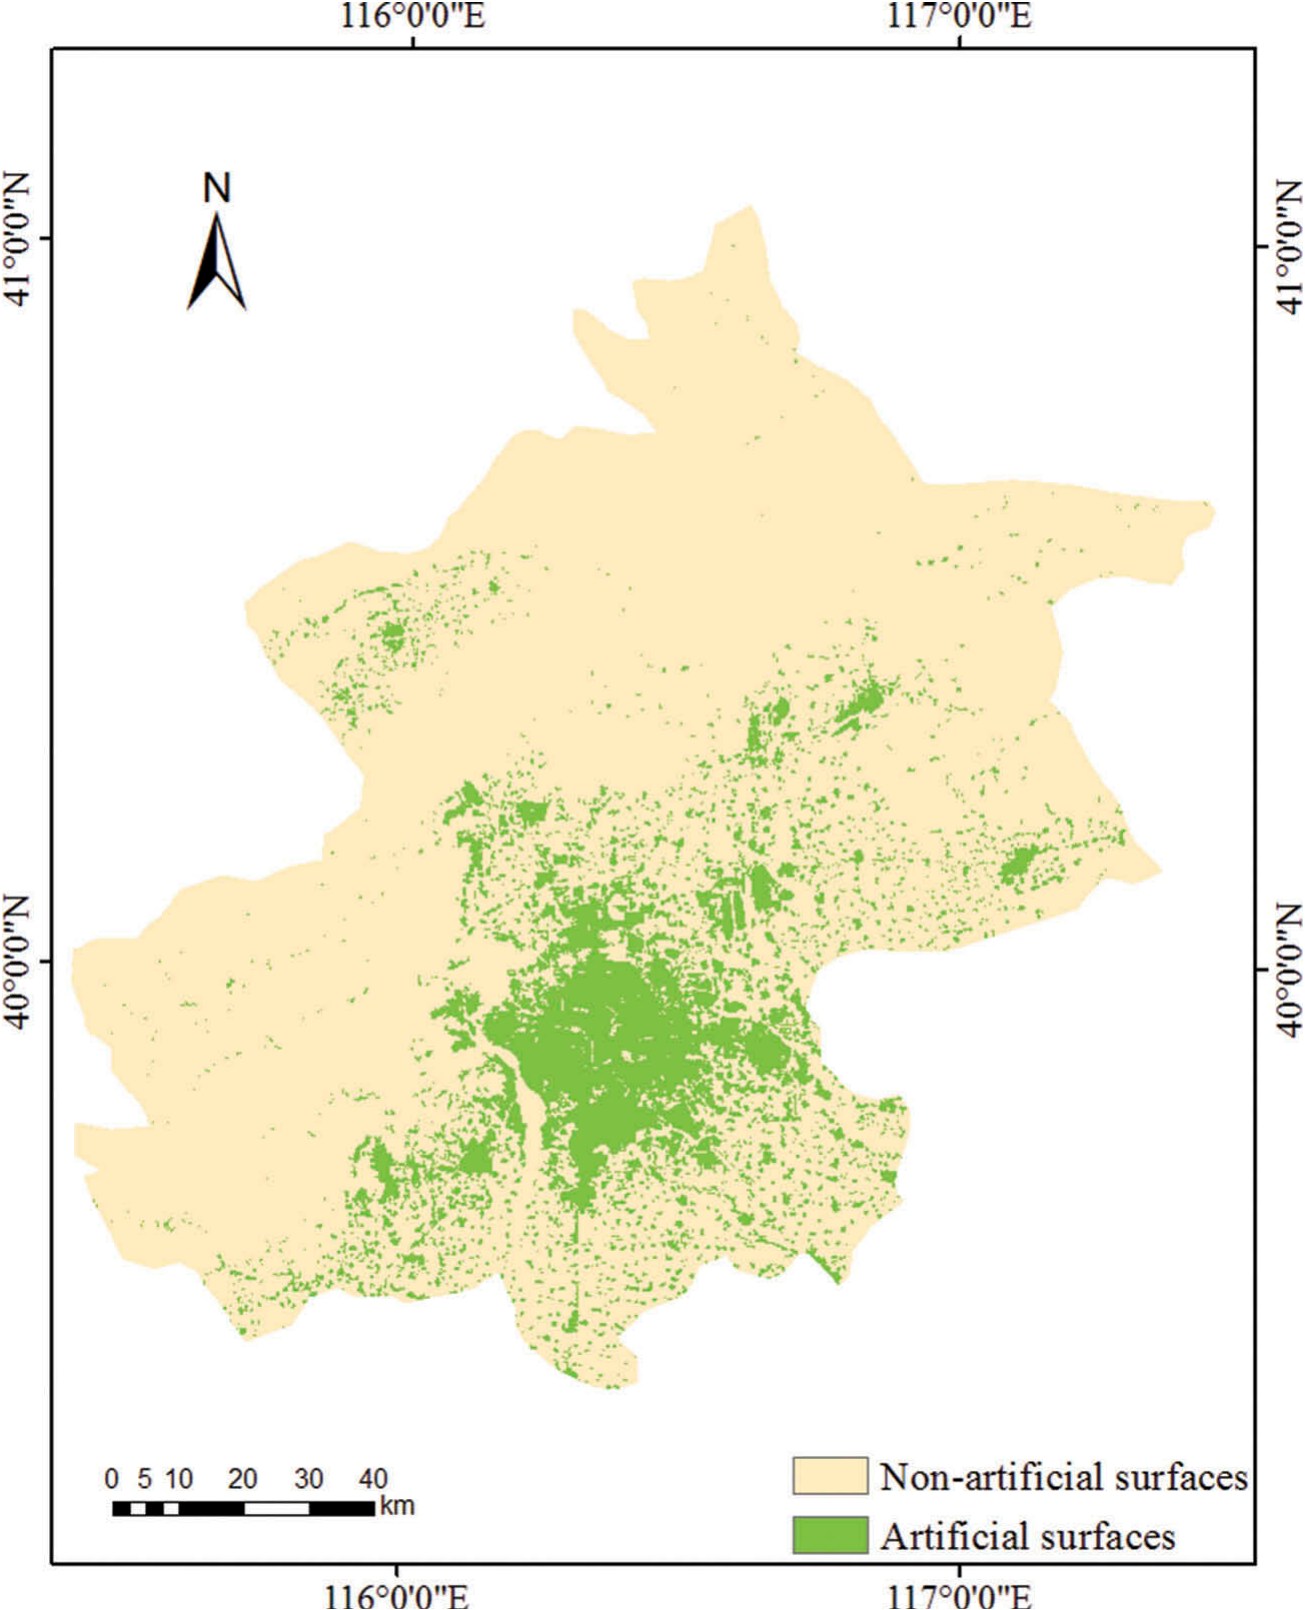
Points of interest as evidence of artificial surfaces
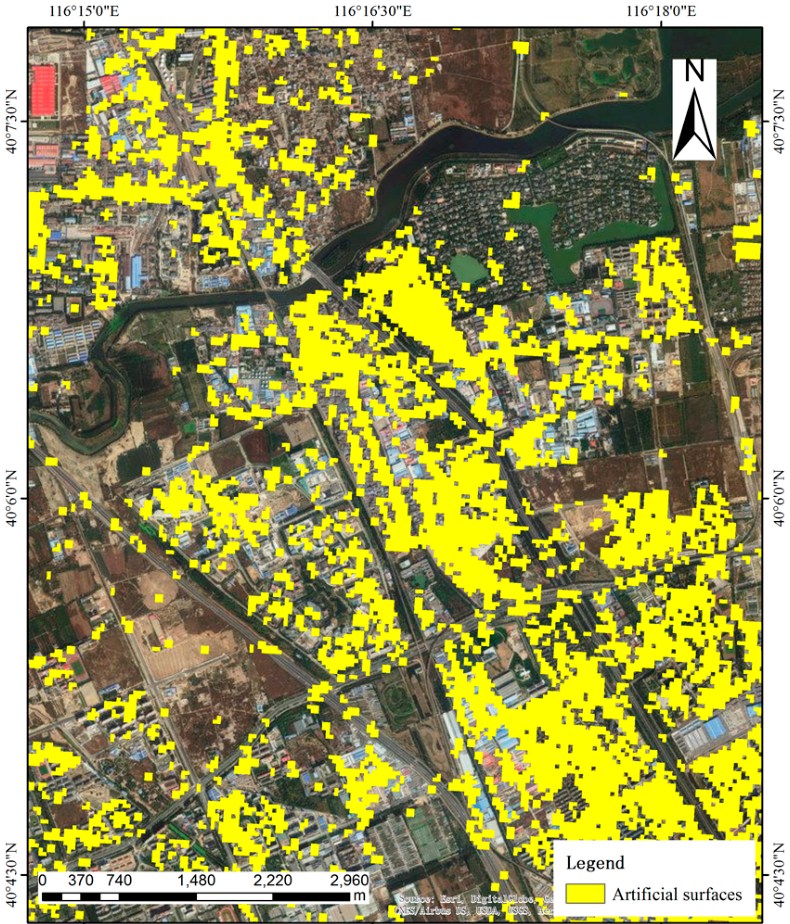
Xing, H., Meng, Y. (co-first author), Hou, D., Cao, F., & Xu, H. (2017). Exploring point-of-interest data from social media for artificial surface validation with decision trees. International Journal of Remote Sensing, 38(23), 6945–6969.
Decision trees classified points of interest as artificial or non-artificial surface using distance to the nearest village and to the nearest road as predictors. Compared cell by cell against GlobeLand30 across 66,058 samples in Beijing, the two agreed for 91.4 percent of them. The residual disagreement was concentrated in parcels below the product's minimum mapping unit, indicating a systematic rather than random source of error.
Theme 2
Classifying land cover directly from volunteered data
Remote Sensing · 2017 · corresponding author
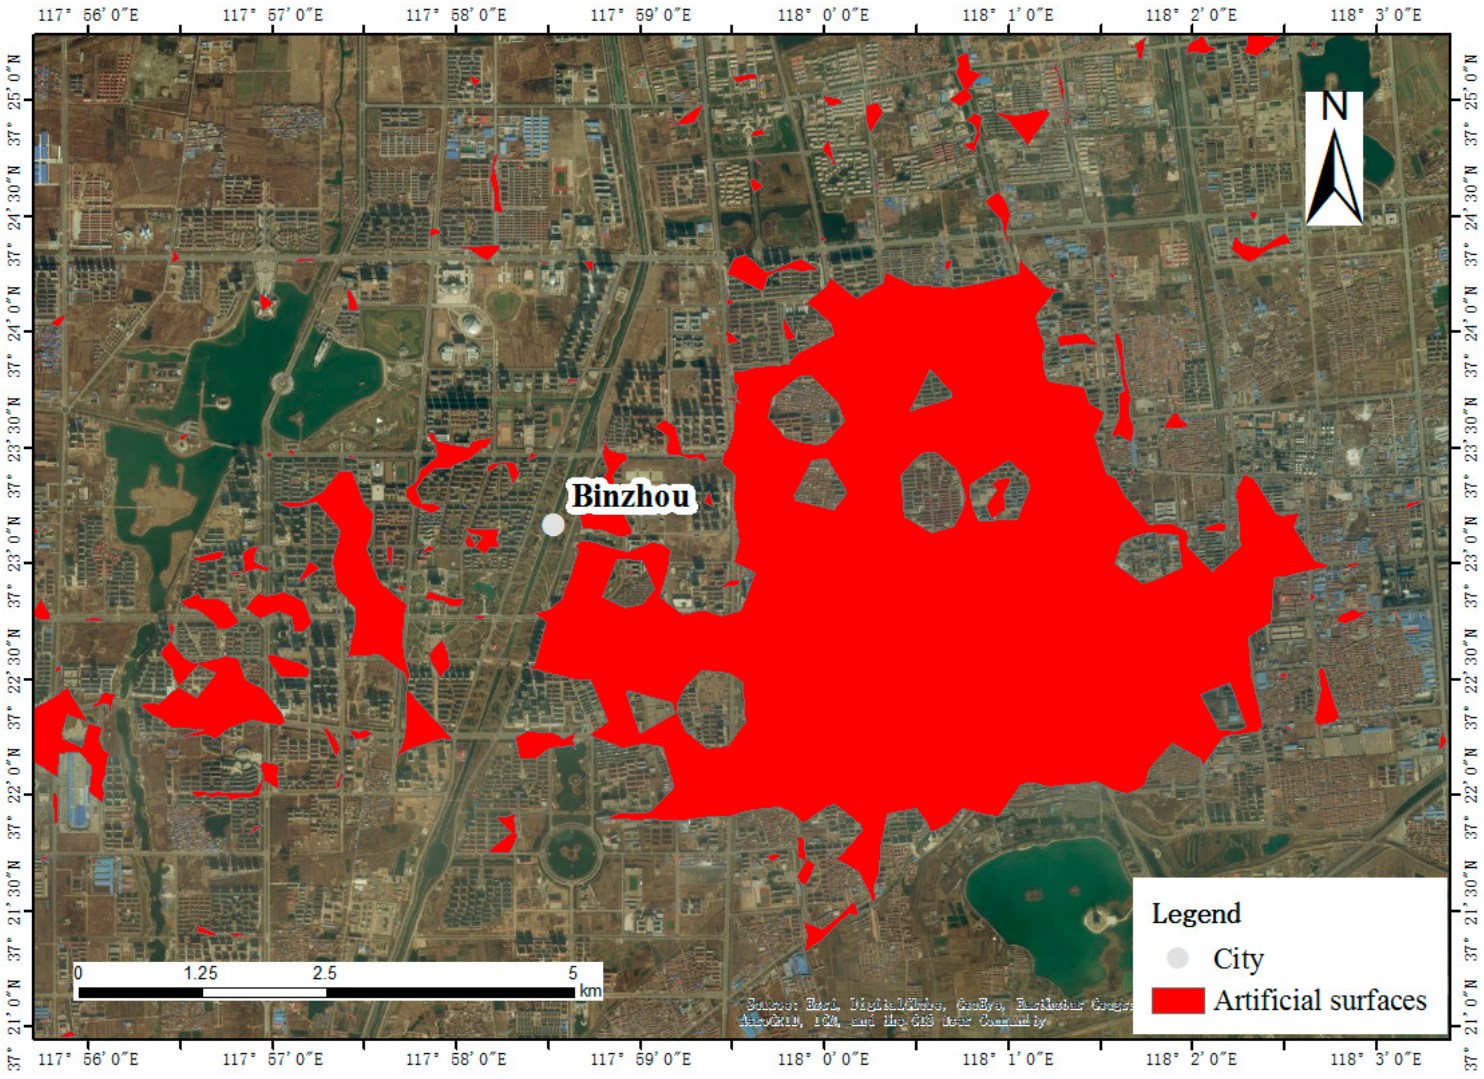
From point clusters to land cover regions, without imagery
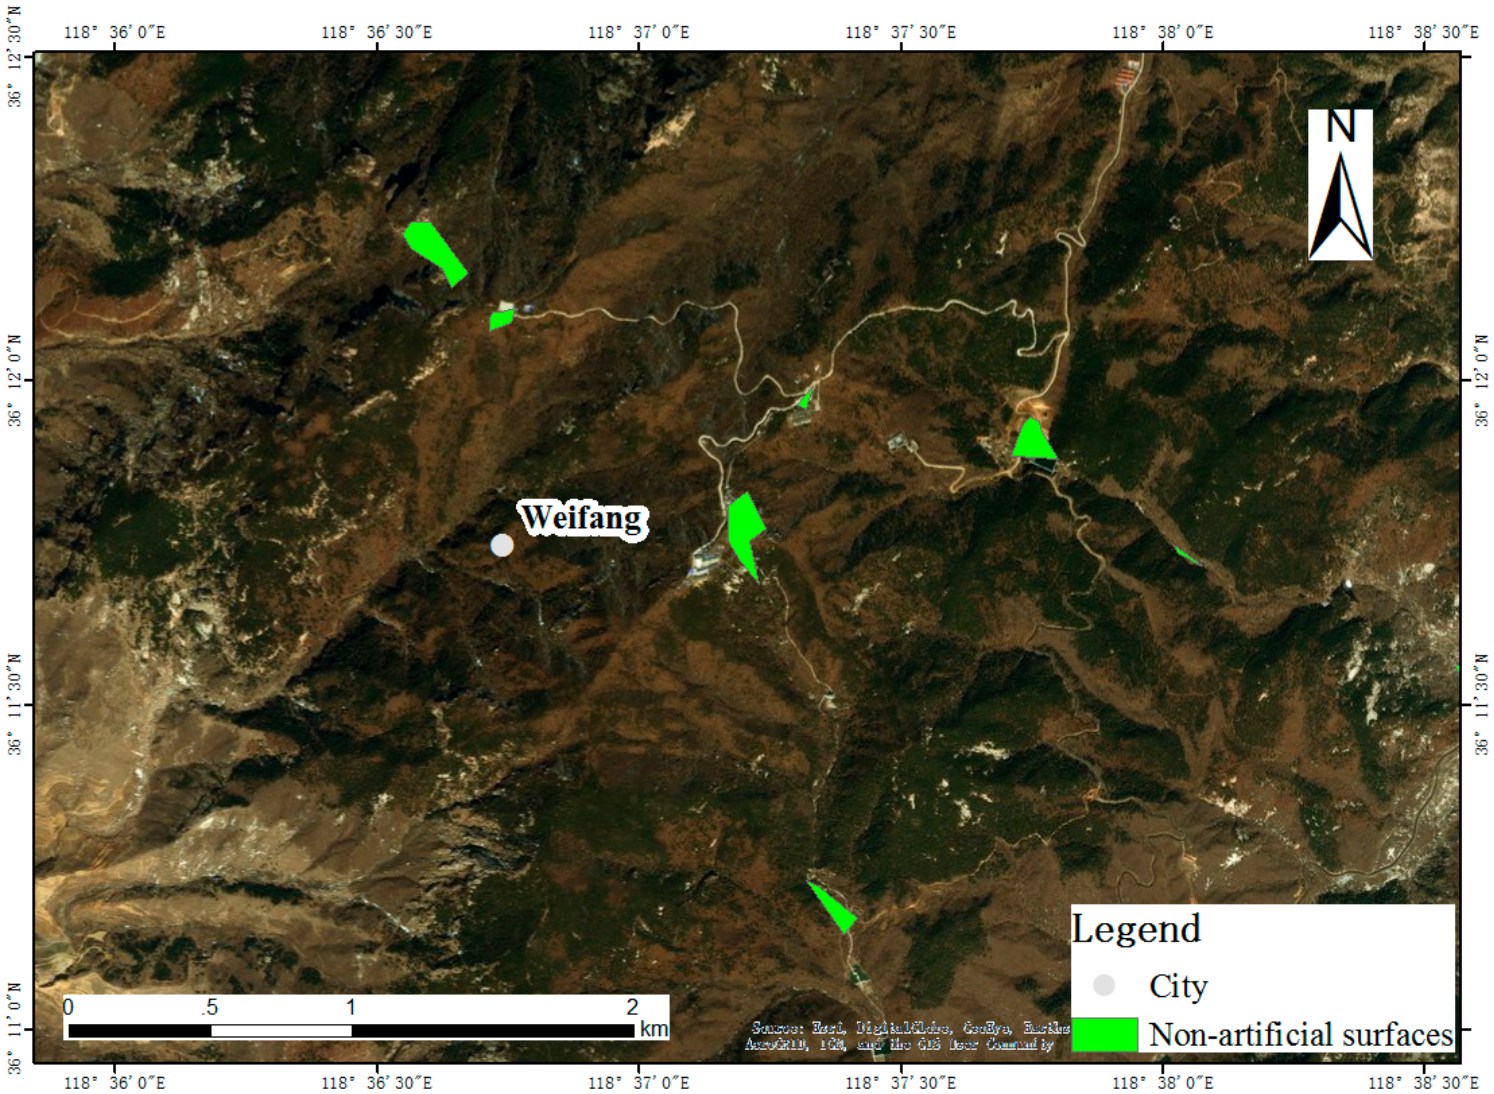
Xing, H., Meng, Y.* (corresponding author), Hou, D., Song, J., & Xu, H. (2017). Employing crowdsourced geographic information to classify land cover with spatial clustering and topic model. Remote Sensing, 9(6), 602.
Density-based clustering grouped points of interest into candidate regions, an adaptive concave hull delineated each region's boundary, and a topic model inferred its land cover class from the mix of point categories it contained. Applied across urban and forested parts of Shandong Province, the procedure produced a land cover classification with no satellite imagery in the processing chain, establishing volunteered data as an independent source rather than only a validation aid.
Theme 3
Detecting change between releases
Sustainability · 2017 · first author
Recovering land cover change in the interval between products
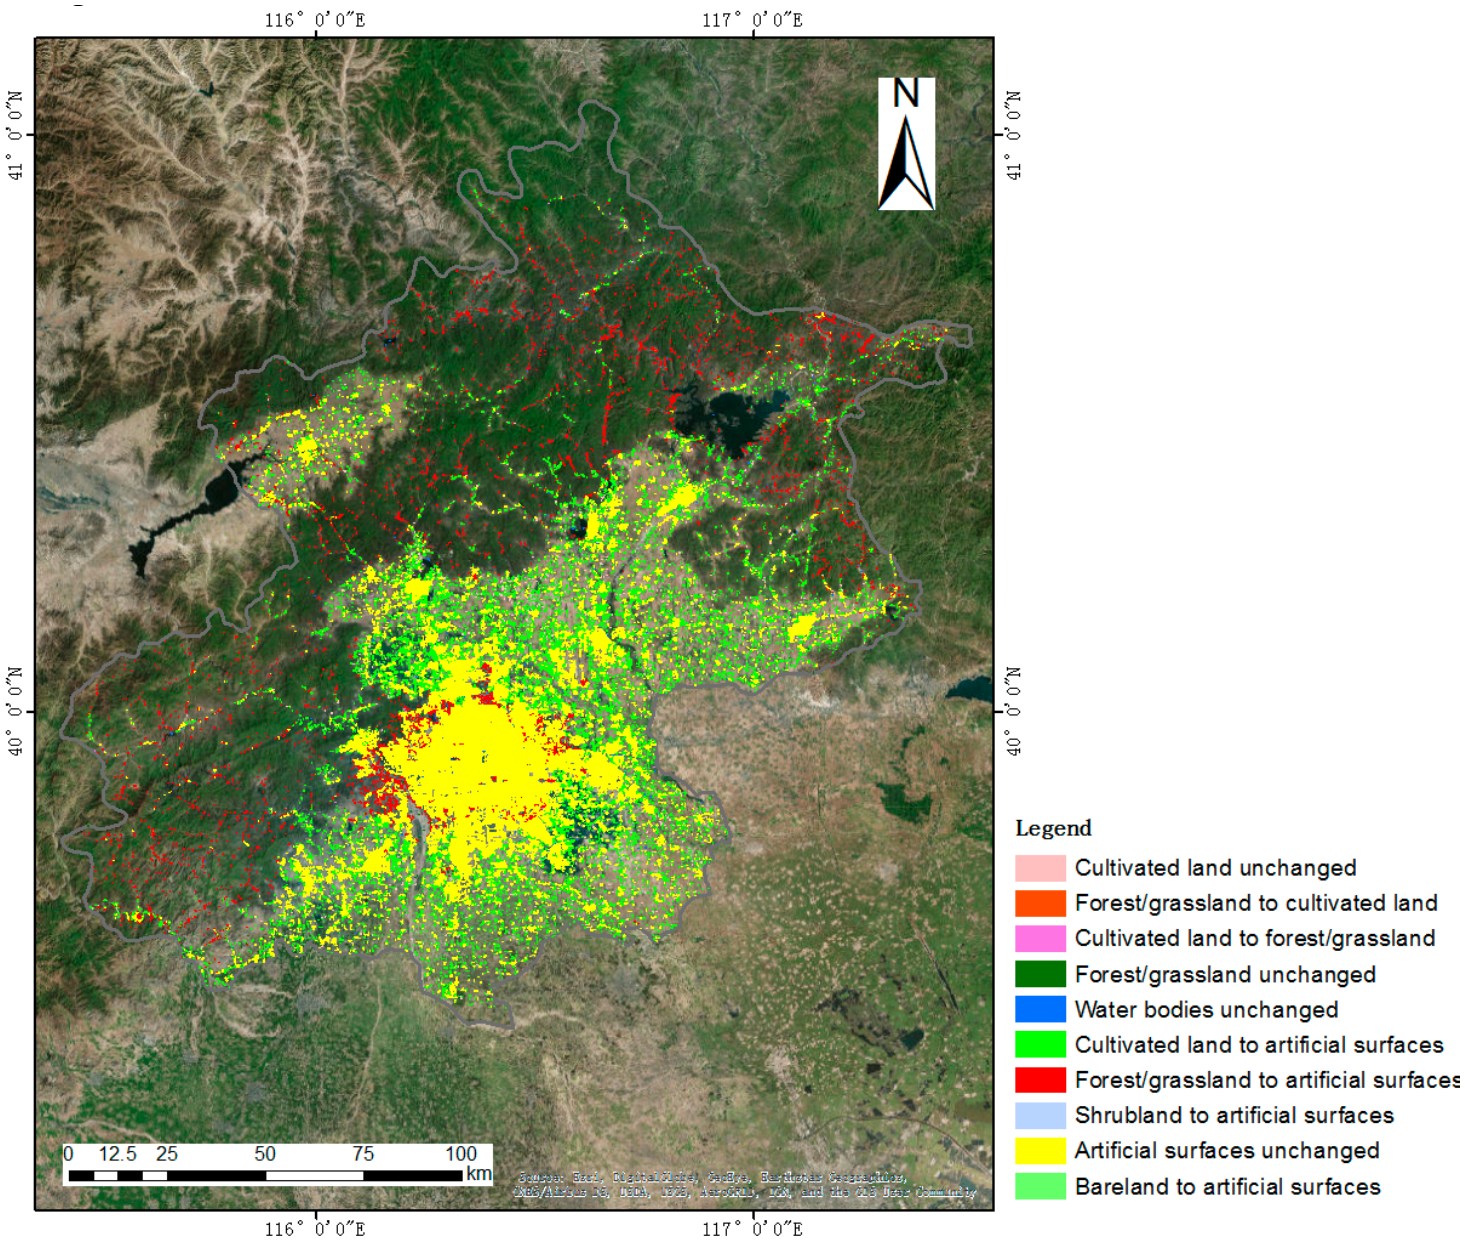
Meng, Y., Hou, D., & Xing, H. (2017). Rapid detection of land cover changes using crowdsourced geographic information: a case study of Beijing, China. Sustainability, 9(9), 1547.
Land cover regions were derived from point-of-interest data for 2016 and compared with GlobeLand30 for 2010, yielding four unchanged and six changed class transitions across Beijing. Classification of the derived regions reached 89.2 percent overall accuracy on 250 validation samples. Conversion of cultivated land and of forest and grassland to artificial surfaces accounted for the majority of detected change.
Theme 4
Explaining land use transformation
Geo-spatial Information Science · 2023 · first author
Attributing megacity urbanization to its spatial scale
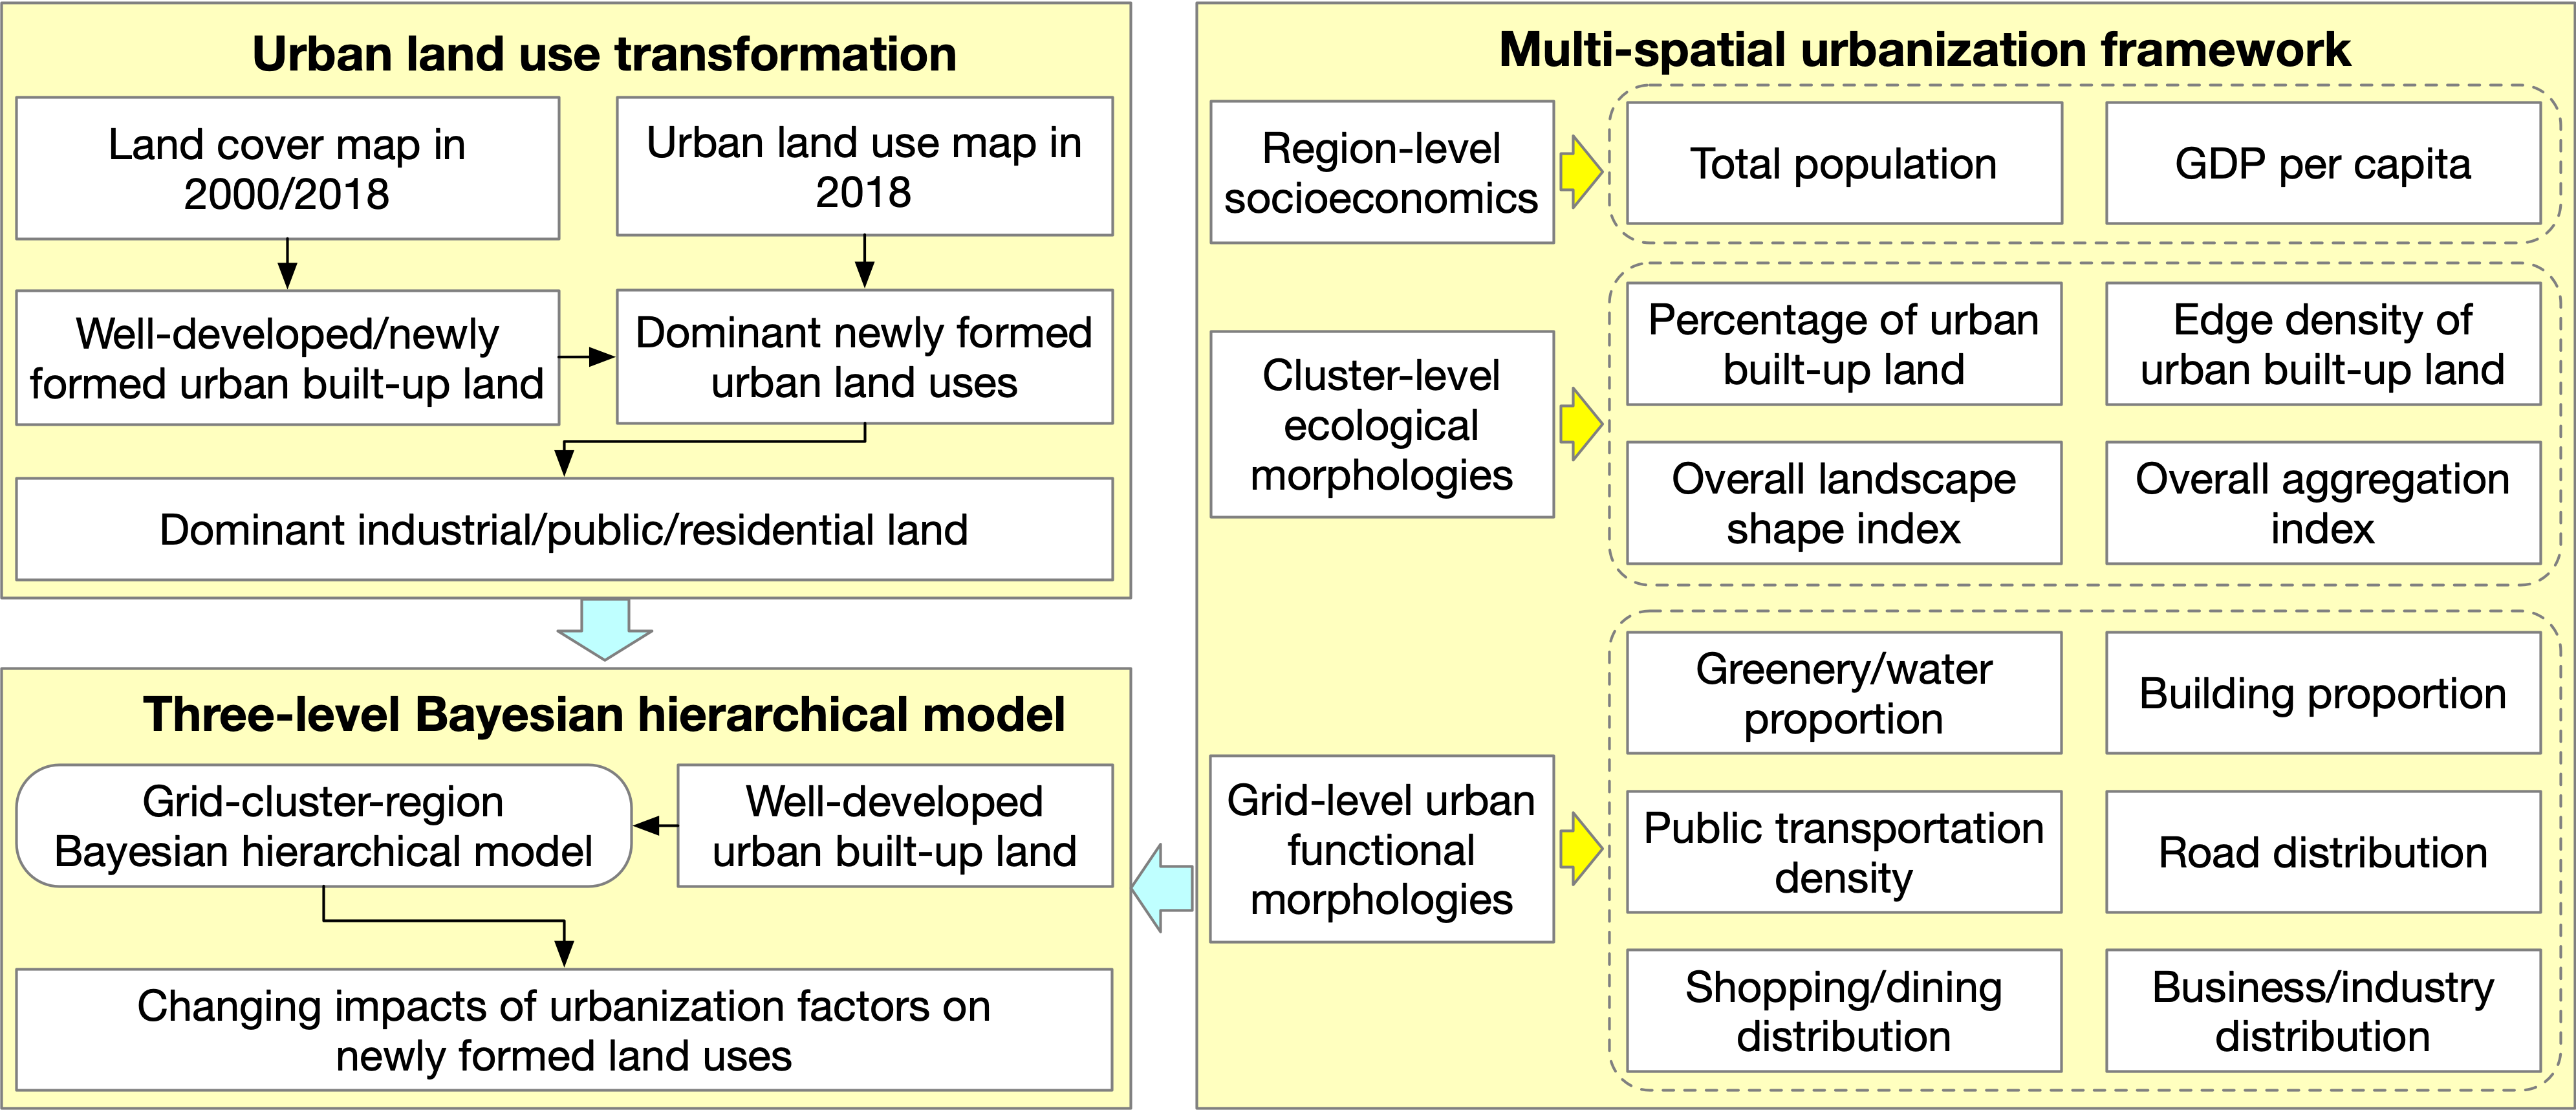
Meng, Y., Wong, M. S., Kwan, M.-P., Pearce, J., & Feng, Z. (2023). Assessing multi-spatial driving factors of urban land use transformation in megacities: a case study of Guangdong–Hong Kong–Macao Greater Bay Area from 2000 to 2018. Geo-spatial Information Science, 1–17.
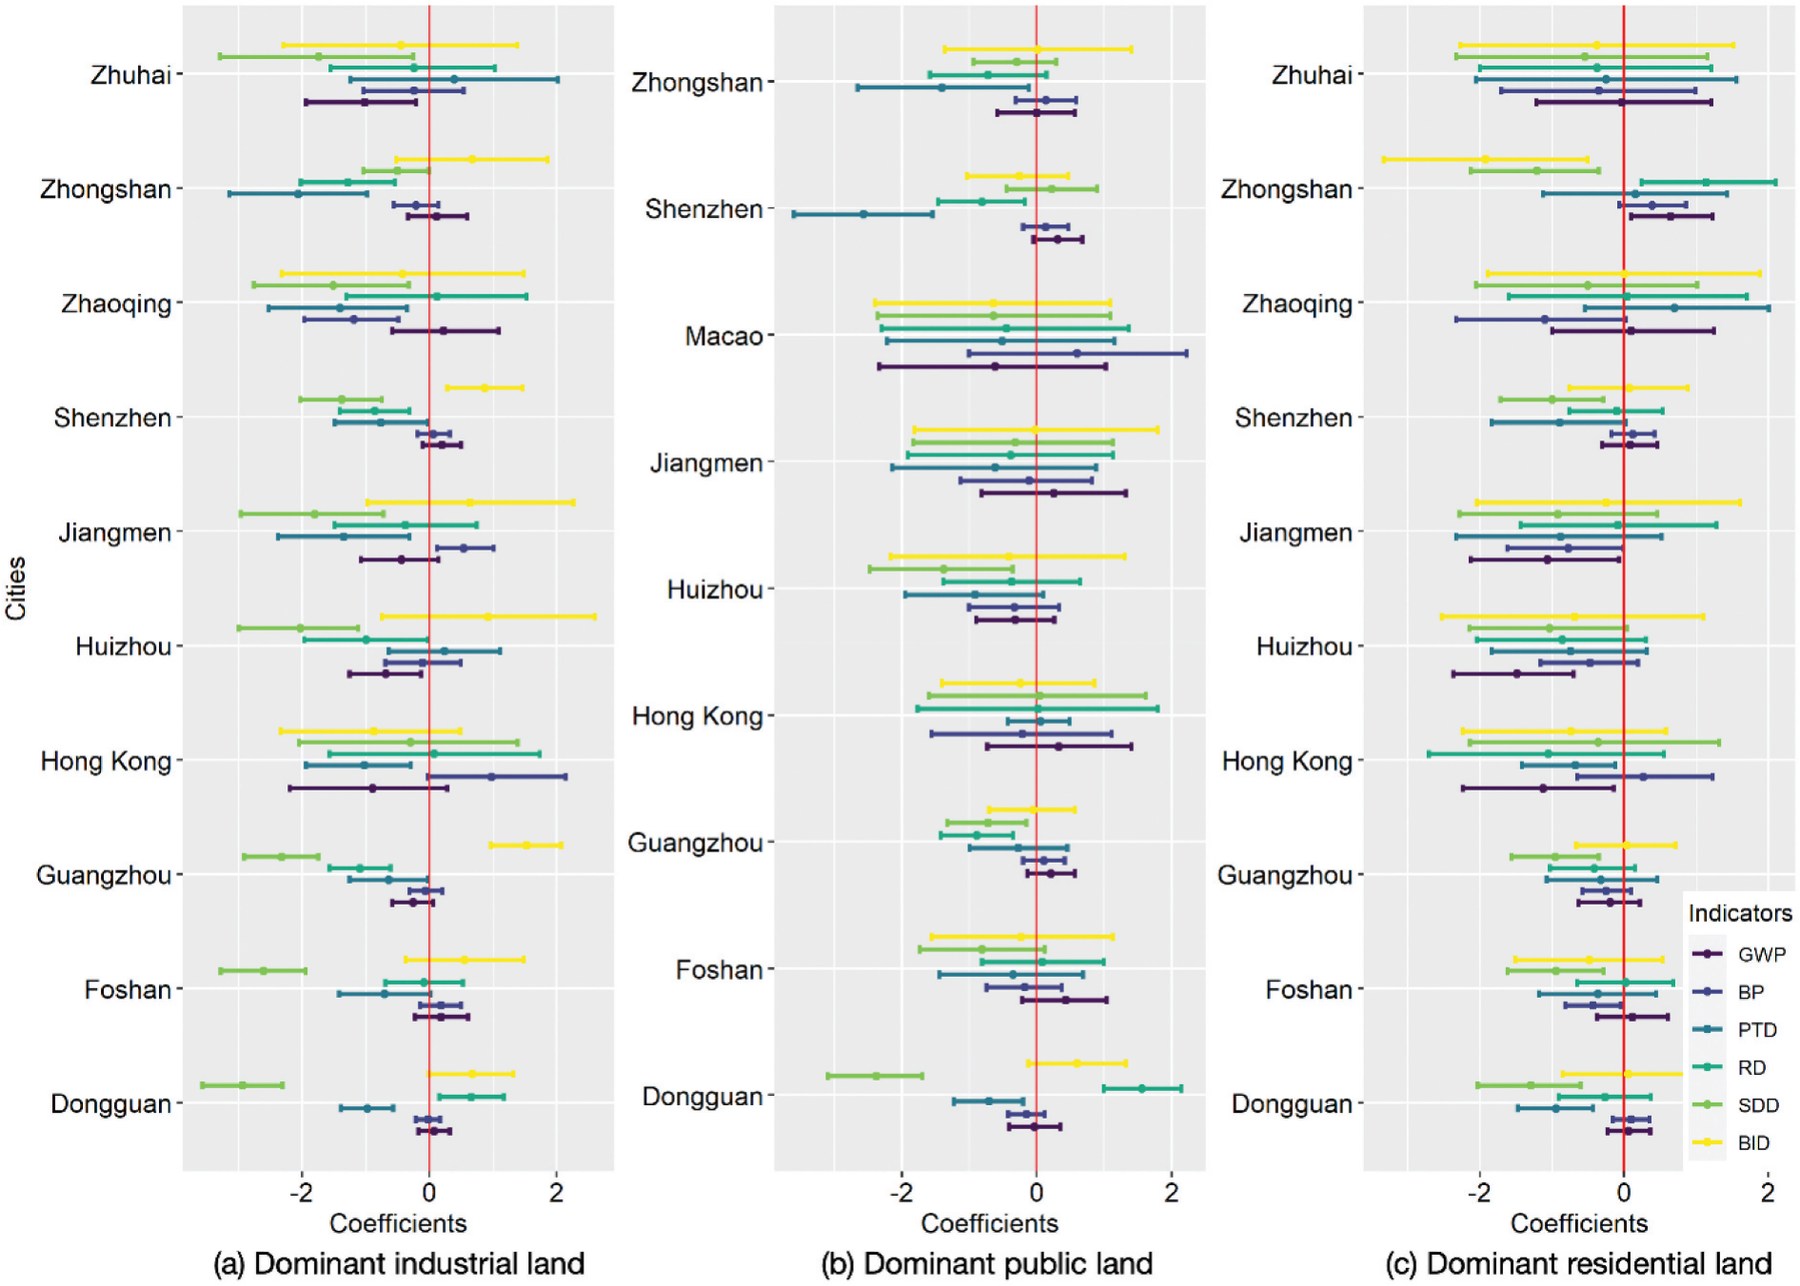
Newly formed urban built-up land between 2000 and 2018 was extracted for the Greater Bay Area and classified into dominant industrial, public, and residential use on a one-kilometer grid. Candidate drivers were assembled at three spatial levels: region-level socioeconomics, cluster-level ecological morphology, and grid-level urban function. A three-level Bayesian hierarchical model estimated their effects jointly.
Effects proved to be scale-specific and city-specific. Road density and public transportation density were among the strongest grid-level associations with dominant industrial land, while the same characteristics behaved differently in Hong Kong, where urban development had already stabilized. Separating the levels prevents the attribution errors that arise when drivers measured at one scale are used to explain outcomes at another.
Continuity
Where this leads
The land cover and land use layers developed here become exposure variables elsewhere in this research program. Urban form measures constructed in these studies are applied in the analysis of urban form, air pollution, and COVID-19 mortality; the same processing chain, applied to food outlets and air pollution surfaces, supplies the exposures used in the cognitive health studies. Mapping the physical environment is the instrument, not the object: it is what makes population-scale environmental health questions answerable.
Summary
Selected papers
2023 Meng, Y., Wong, M. S., Kwan, M.-P., Pearce, J., & Feng, Z. Assessing multi-spatial driving factors of urban land use transformation in megacities: Guangdong–Hong Kong–Macao Greater Bay Area from 2000 to 2018. Geo-spatial Information Science, 1–17.first author
What drives new urban land is scale-specific and city-specific: a three-level Bayesian hierarchical model separates regional economics, cluster-level form, and grid-level function.
2018 Xing, H., Meng, Y.*, Wang, Z., Fan, K., & Hou, D. Exploring geo-tagged photos for land cover validation with deep learning. ISPRS Journal of Photogrammetry and Remote Sensing, 141, 237–251.corresponding
A convolutional network trained on 10,345 photographs replaces the human interpreter in land cover validation, making accuracy assessment tractable at scales where expert interpretation is not.
2017 Xing, H., Meng, Y., Hou, D., Cao, F., & Xu, H. Exploring point-of-interest data from social media for artificial surface validation with decision trees. International Journal of Remote Sensing, 38(23), 6945–6969.co-first
Points of interest agree with GlobeLand30 built-up land for 91.4 percent of 66,058 samples, and the disagreement concentrates below the product’s minimum mapping unit.
2017 Xing, H., Meng, Y.*, Hou, D., Song, J., & Xu, H. Employing crowdsourced geographic information to classify land cover with spatial clustering and topic model. Remote Sensing, 9(6), 602.corresponding
Clustering points of interest and fitting concave hulls produces a land cover classification with no satellite imagery in the processing chain.
2017 Meng, Y., Hou, D., & Xing, H. Rapid detection of land cover changes using crowdsourced geographic information: a case study of Beijing, China. Sustainability, 9(9), 1547.first author
Two snapshots of point-of-interest data six years apart recover land cover change between official map releases at 89.2 percent overall accuracy.