Place & Mental Health
Two studies replacing single-number exposures with data-driven typologies: trajectories of addictive screen use in 4,285 adolescents, and social determinant clusters across 3,018 United States counties.
Research question
Which environments accumulate into mental health risk?
Screen time and area deprivation are both normally entered into a model as a single number. That compresses a multidimensional environment into one dimension, and it discards the shape of exposure over time. A child who uses social media heavily throughout adolescence and one whose use climbs steeply from age eleven can have the same average; a rural county with old housing and a dense county with unequal income can score alike on a deprivation index while presenting entirely different risks.
Both studies here replace that single number with a data-driven typology, then ask what the typology predicts. In each case the pattern carries risk that the level does not, and the risk falls unevenly across sex, age, and race and ethnicity. The two studies work at opposite ends of the scale, one following individuals through four years of adolescence and one following counties across a decade, but they make the same methodological argument.
Approach
Three moves across two studies
Replace the measure with a typology
Latent class linear mixed models recover trajectories of addictive use. Unsupervised clustering recovers county types from 284 social determinant variables. Neither compresses the environment into a single ordered score.
Let exposure accumulate
Exposure is measured repeatedly, across four years of adolescence and across a decade of county history, so that the trajectory rather than the level enters the model as the predictor.
Estimate the disparity, not the average
Risk ratios by trajectory and incidence rate ratios by cluster are reported for sex, age, and race and ethnicity subgroups, because the purpose of a typology is that the groups within it differ.
Theme 1
The environment a child grows up inside
JAMA · 2025 · co-first author
Addictive use trajectories, not total screen time
Xiao, Y., Meng, Y. (co-first author), Brown, T. T., Keyes, K. M., & Mann, J. J. (2025). Addictive screen use trajectories and suicidal behaviors, suicidal ideation, and mental health in US youths. JAMA. doi:10.1001/jama.2025.7829
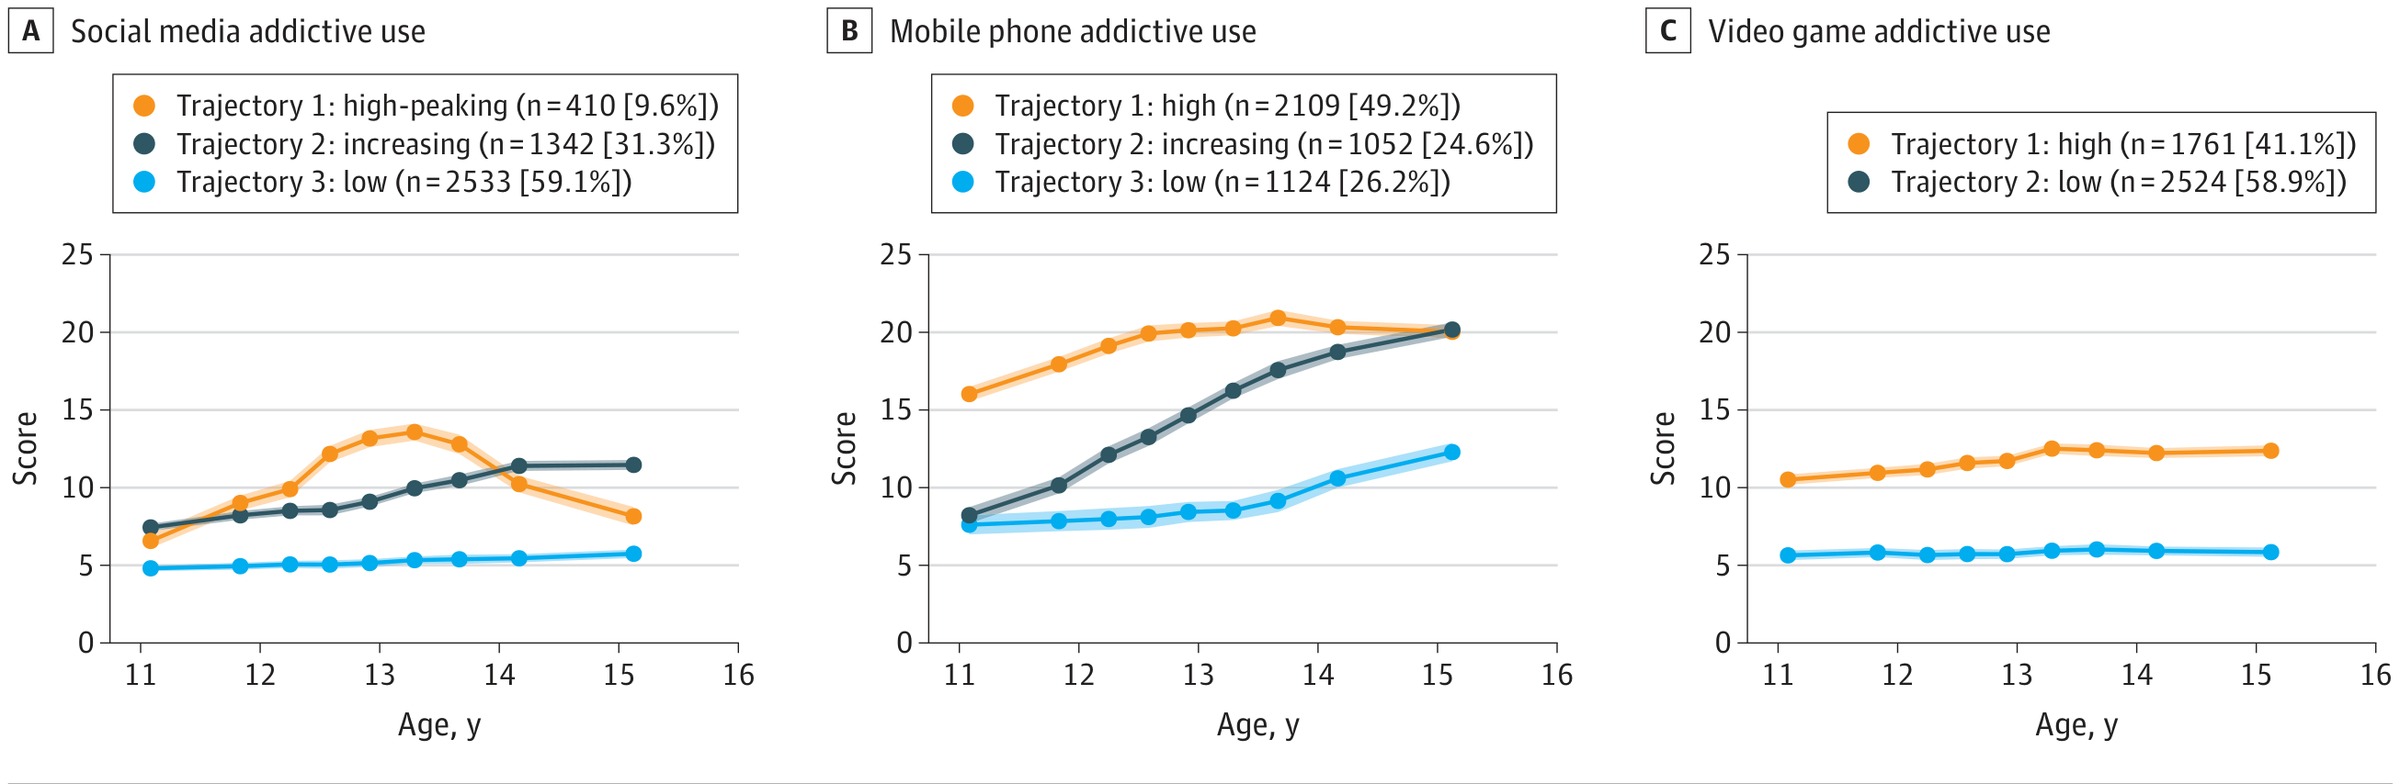
Data from the Adolescent Brain Cognitive Development Study, covering 2016 to 2022 across twenty-one United States sites, were used to identify trajectories of addictive use of social media, mobile phones, and video games from validated child-reported measures at the year 2, year 3, and year 4 follow-ups. The analytic sample was 4,285 youths with a mean baseline age of 10.0 years. Latent class linear mixed models recovered three trajectories for social media and for mobile phones and two for video games. Nearly one-third of participants followed an increasing addictive use trajectory for social media or mobile phones beginning at age eleven.
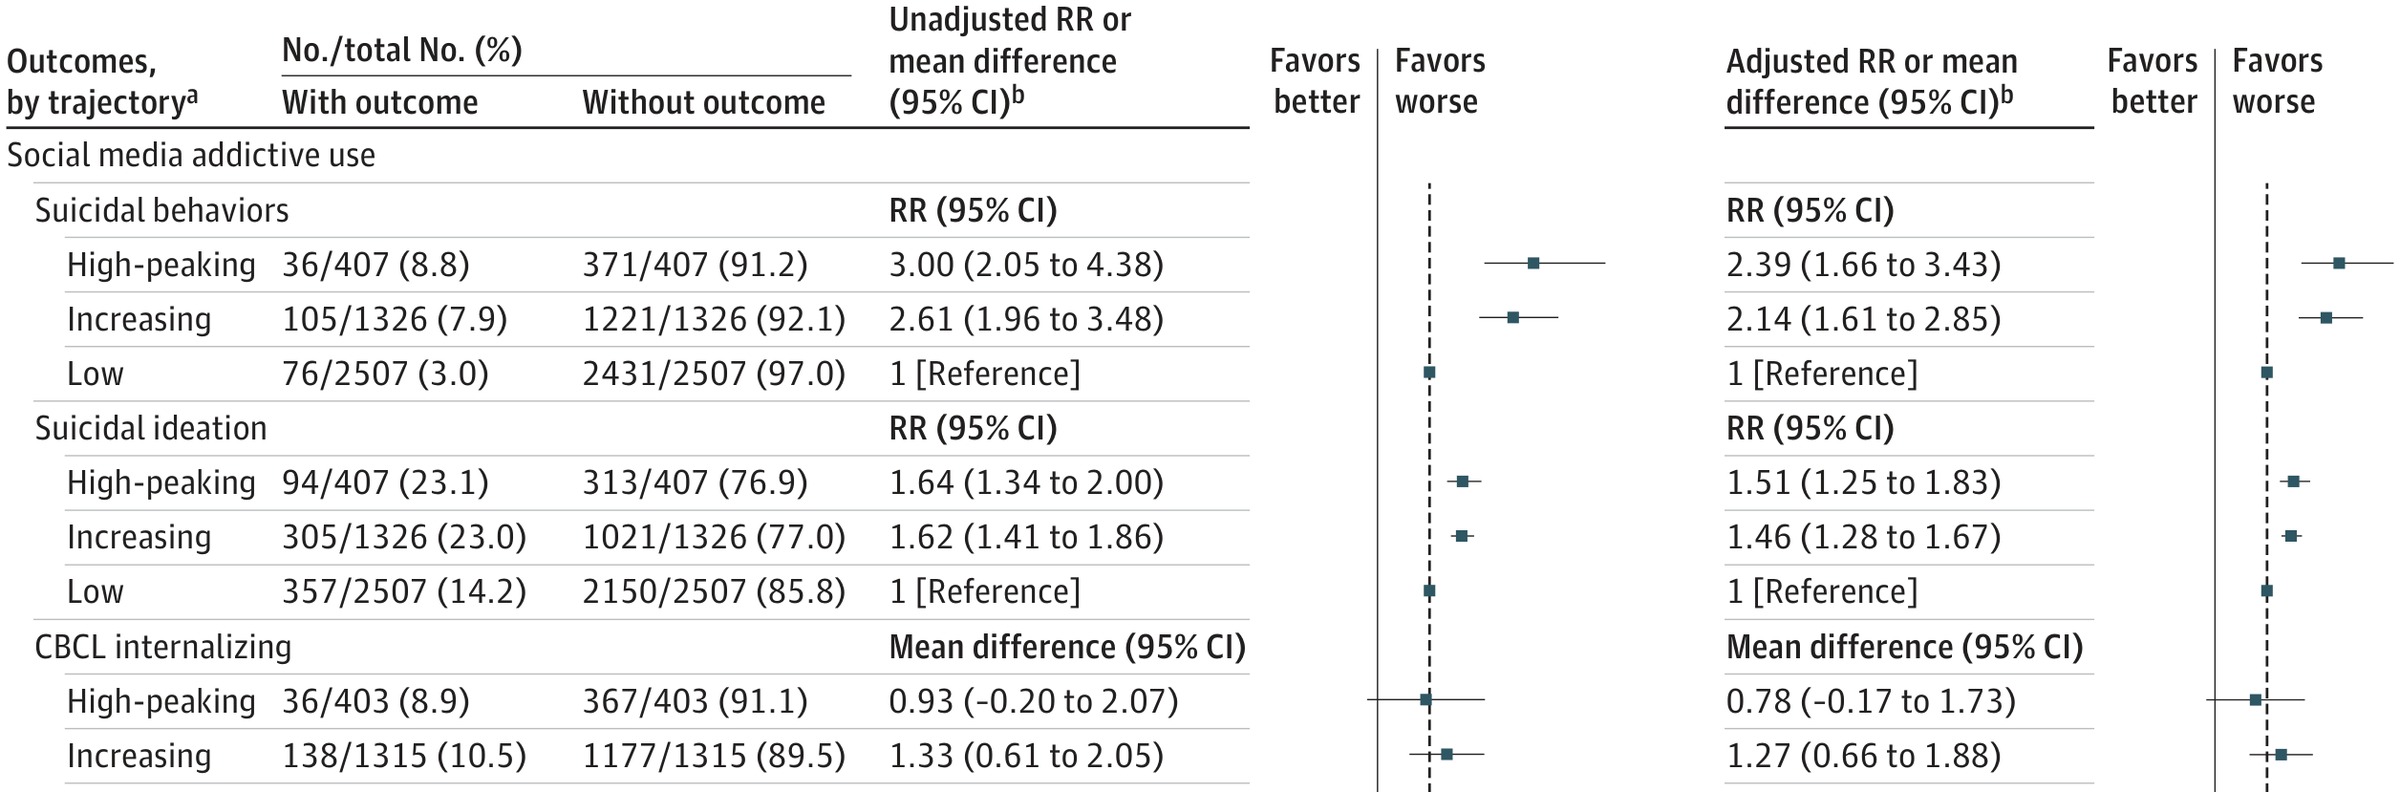
In adjusted models, an increasing addictive use trajectory for social media carried a risk ratio of 2.14 (95% CI, 1.61 to 2.85) for suicidal behaviors relative to the low trajectory, and a high-peaking trajectory carried 2.39 (1.66 to 3.43). High trajectories were associated with suicide-related outcomes for every screen type. Baseline total screen time, entered on its own, was not associated with suicidal behaviors, suicidal ideation, or internalizing or externalizing symptoms. The pattern of use over time carries the risk that the amount of use does not, which is why a cross-sectional measure of hours per day has produced such an inconsistent literature.
Theme 2
The environment a county provides
Nature Mental Health · 2025 · co-first author
Social determinants as county types rather than an index
Xiao, Y., Meng, Y. (co-first author), Brown, T. T., Tsai, A. C., Snowden, L. R., Chow, J. C.-C., Pathak, J., & Mann, J. J. (2025). Machine learning to investigate policy-relevant social determinants of health and suicide rates in the United States. Nature Mental Health, 1–10.
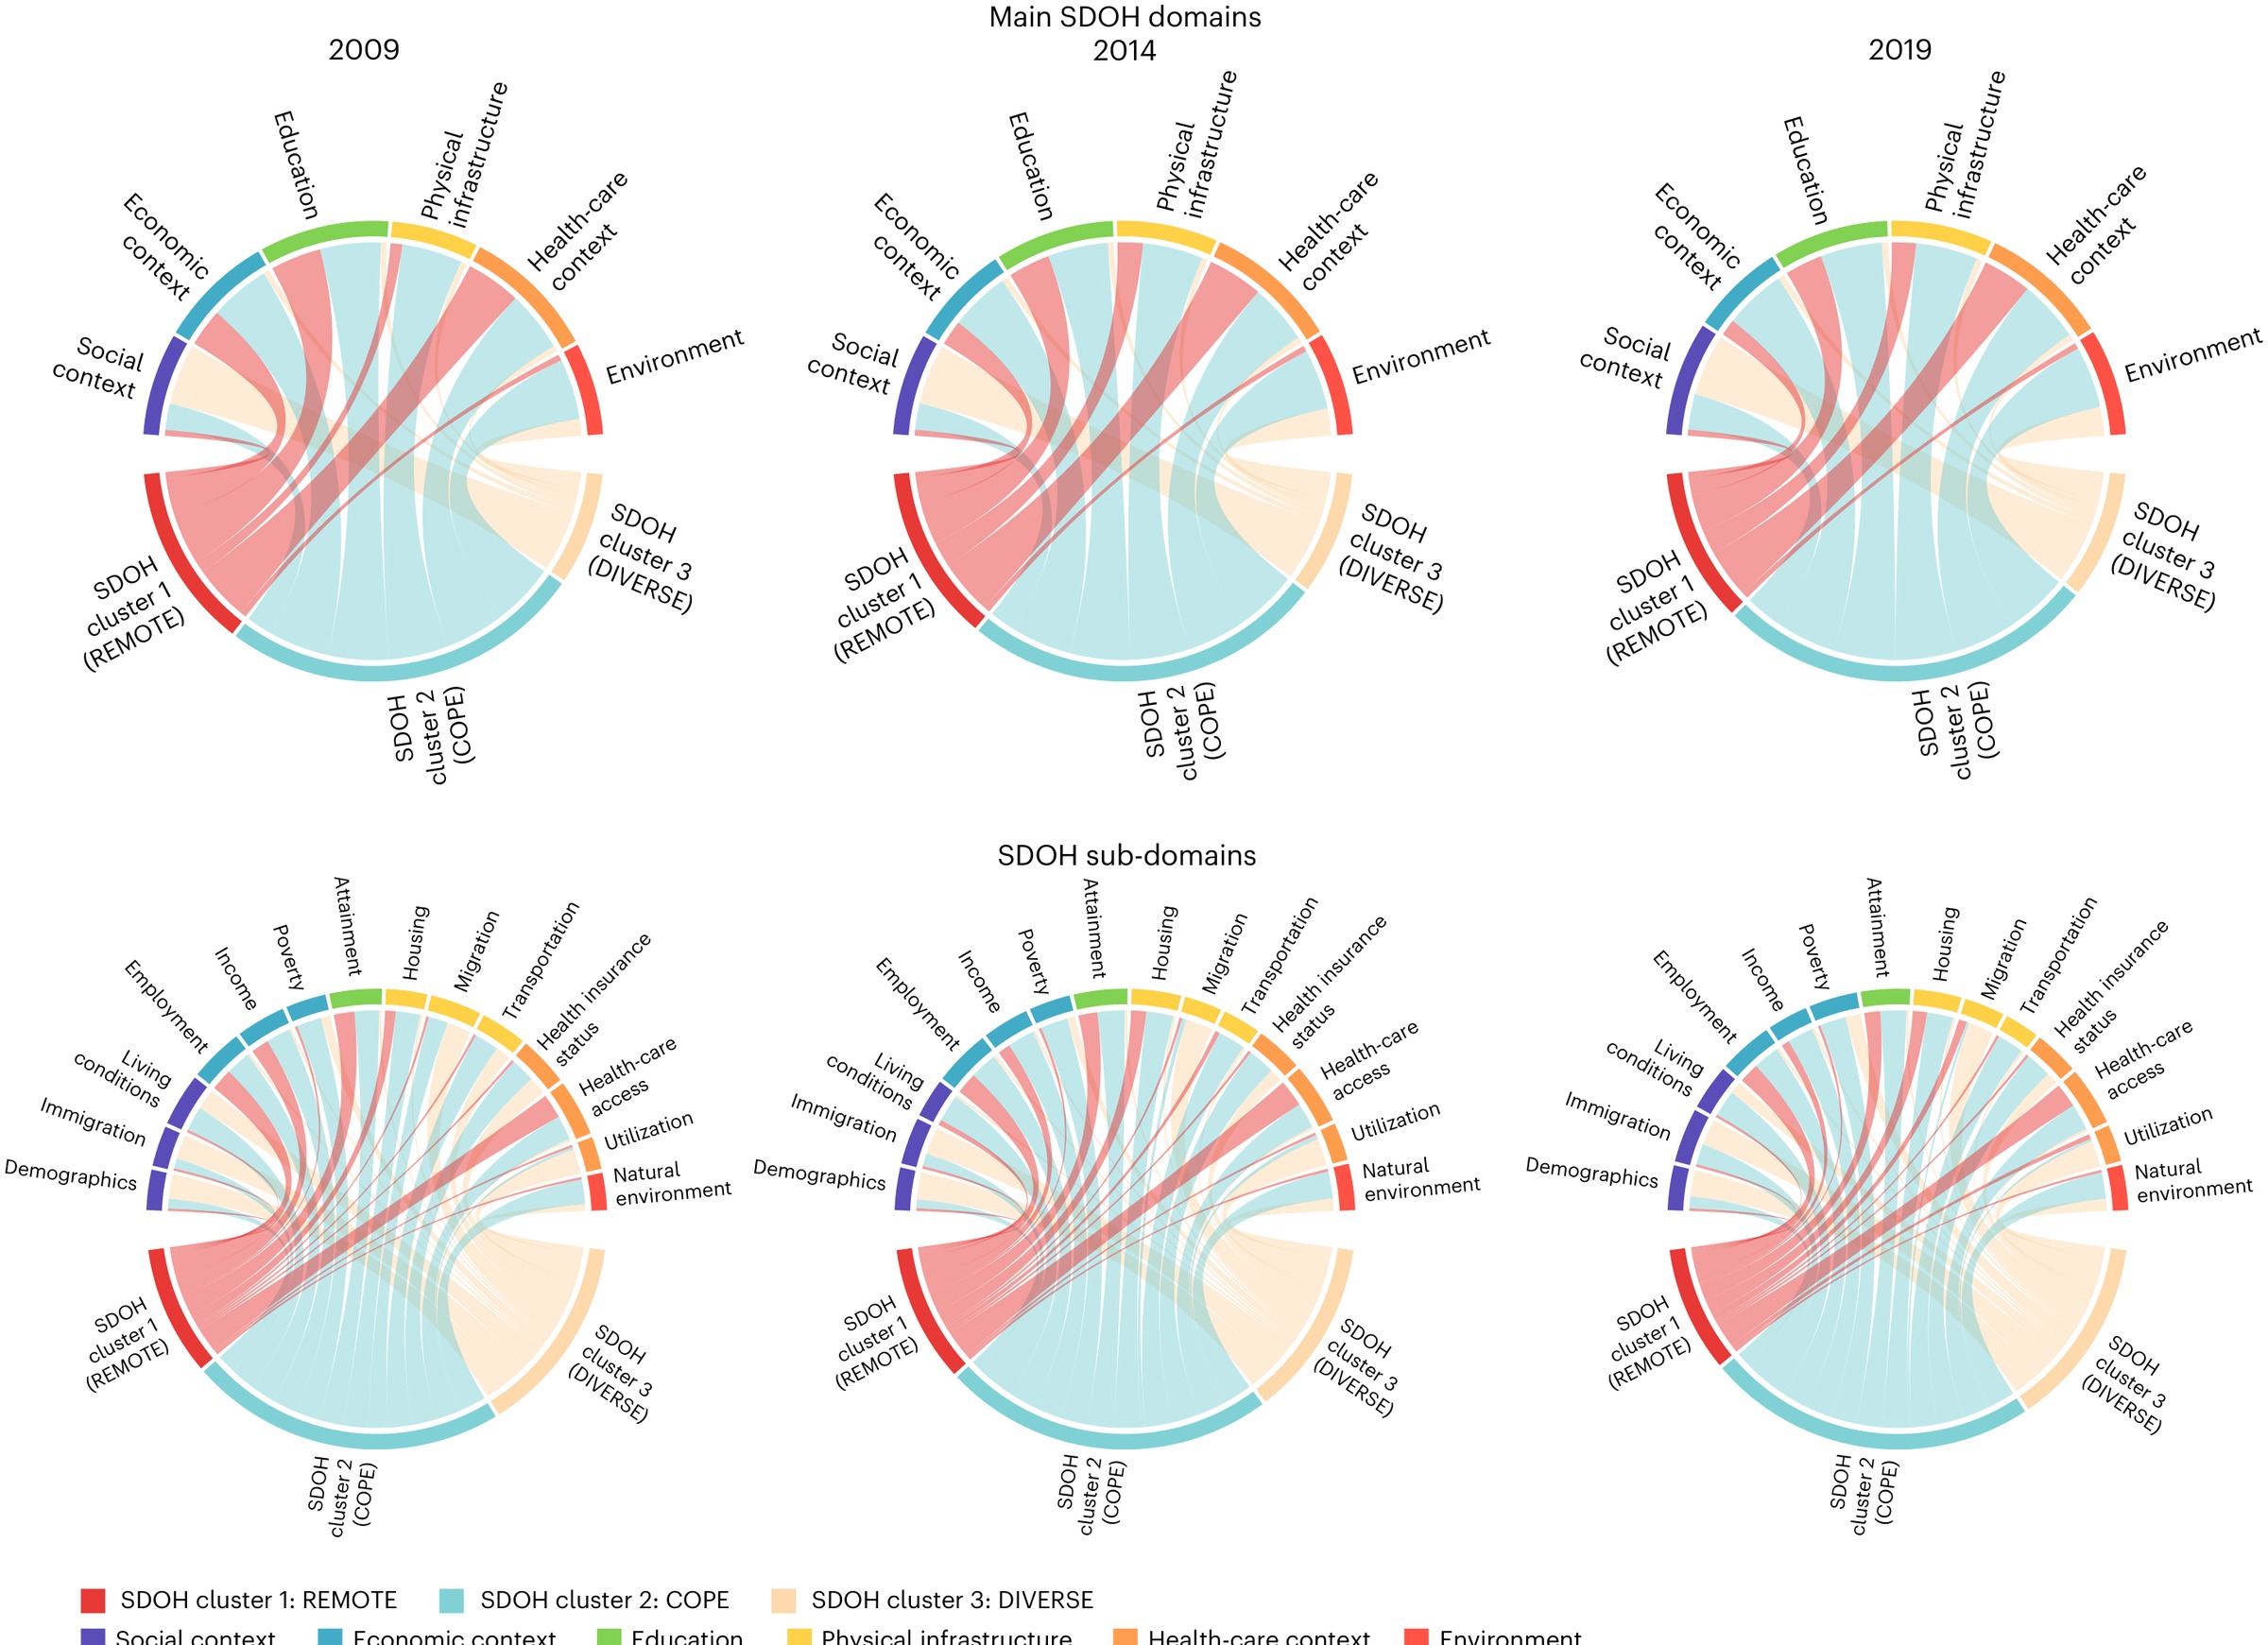
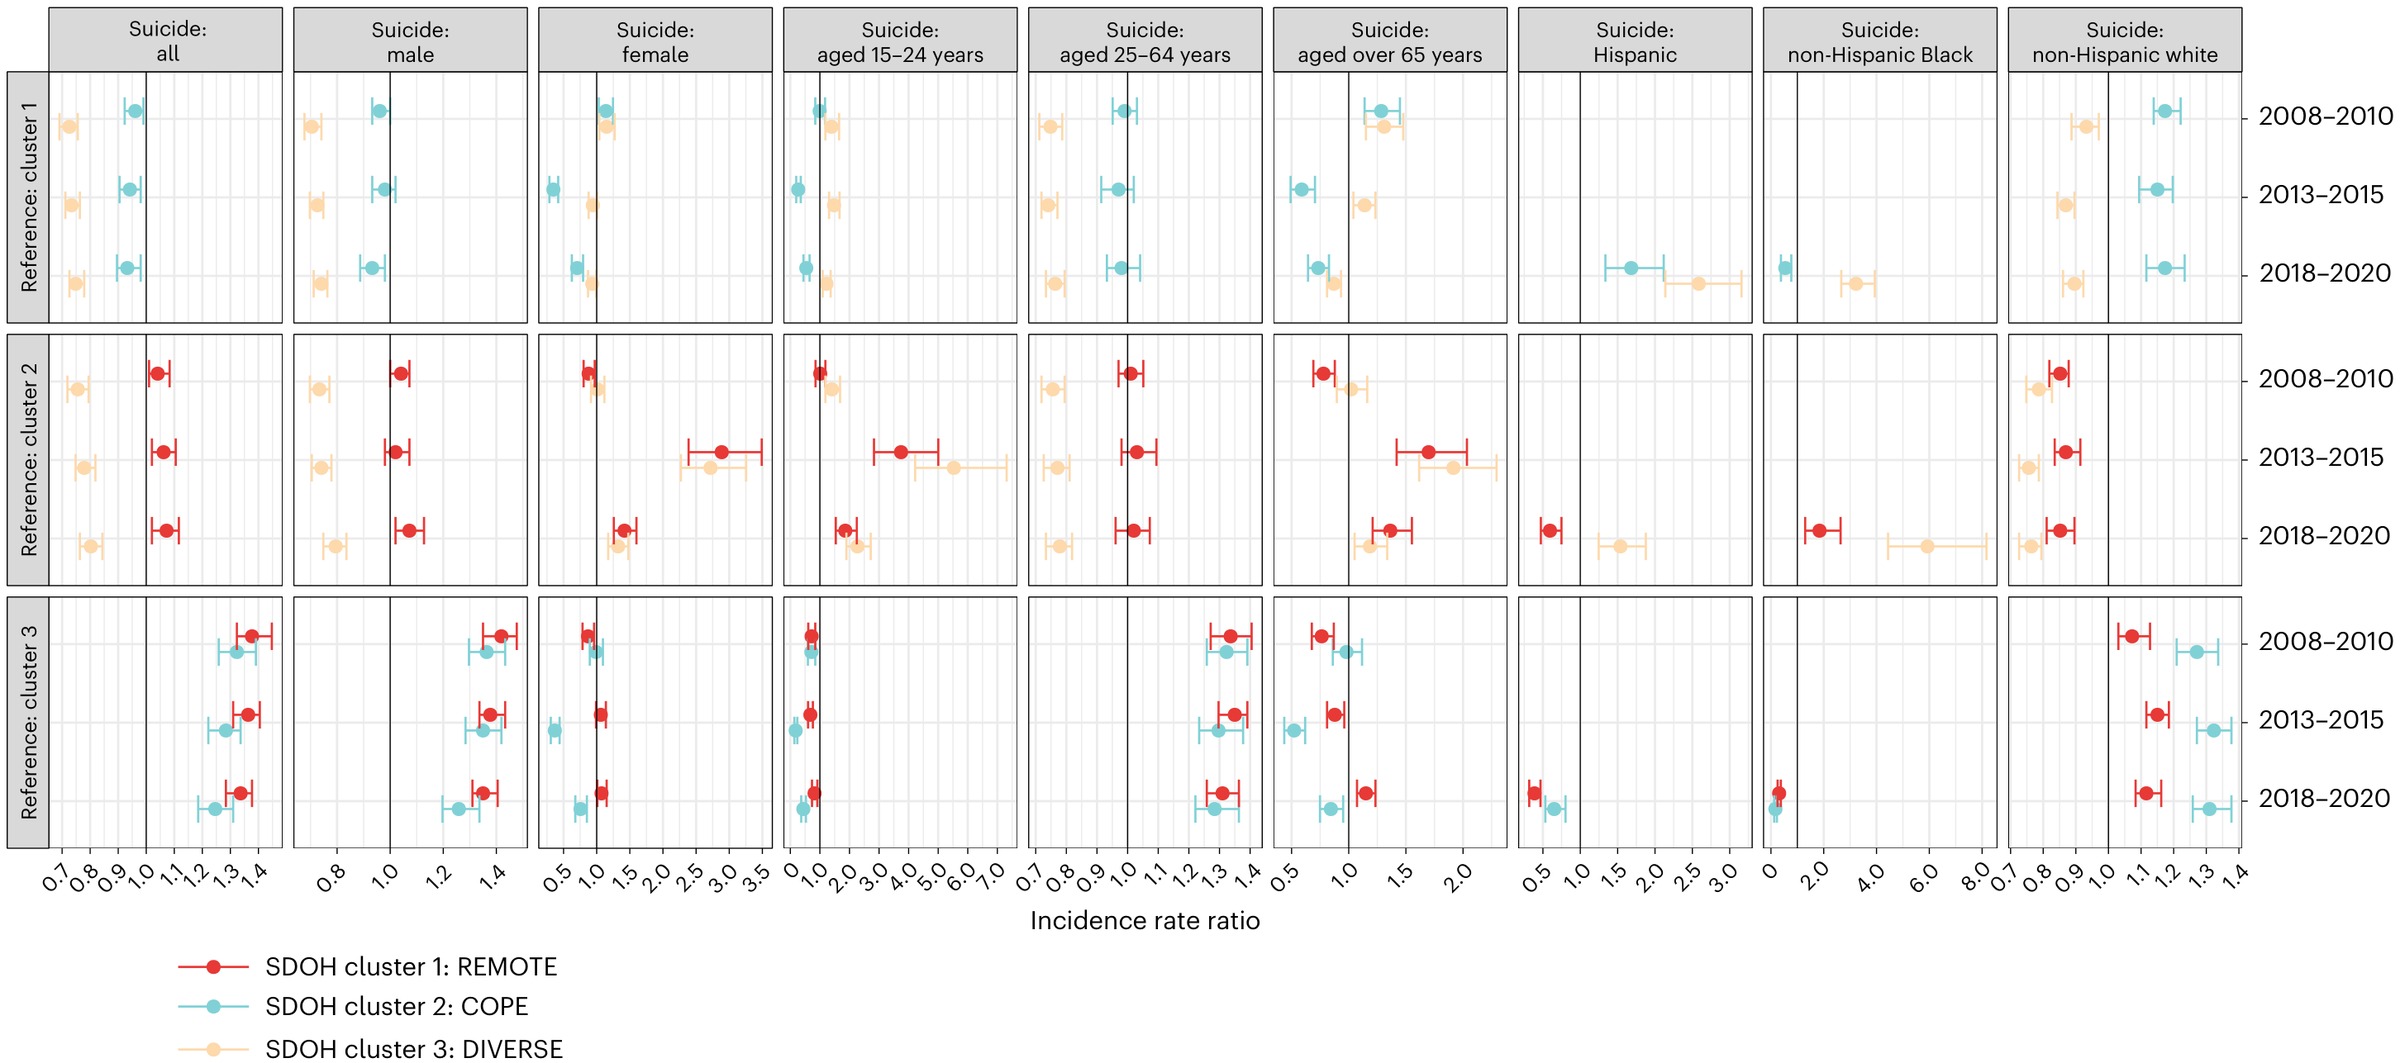
Aggregated social determinant data across 3,018 United States counties for 2009, 2014, and 2019 were linked to county suicide rates from the National Vital Statistics System. Unsupervised clustering over 284 variables identified three county types rather than a ranking. REMOTE counties are rural and elderly, with marginalized environments, old housing, traditional systems, and empty houses. COPE counties combine complex family dynamics, high consumption of health services, poverty, and extreme heat. DIVERSE counties are dense, immigrant-rich, environmentally challenged, economically unequal, racially and ethnically diverse, with saturated health care and expensive housing.
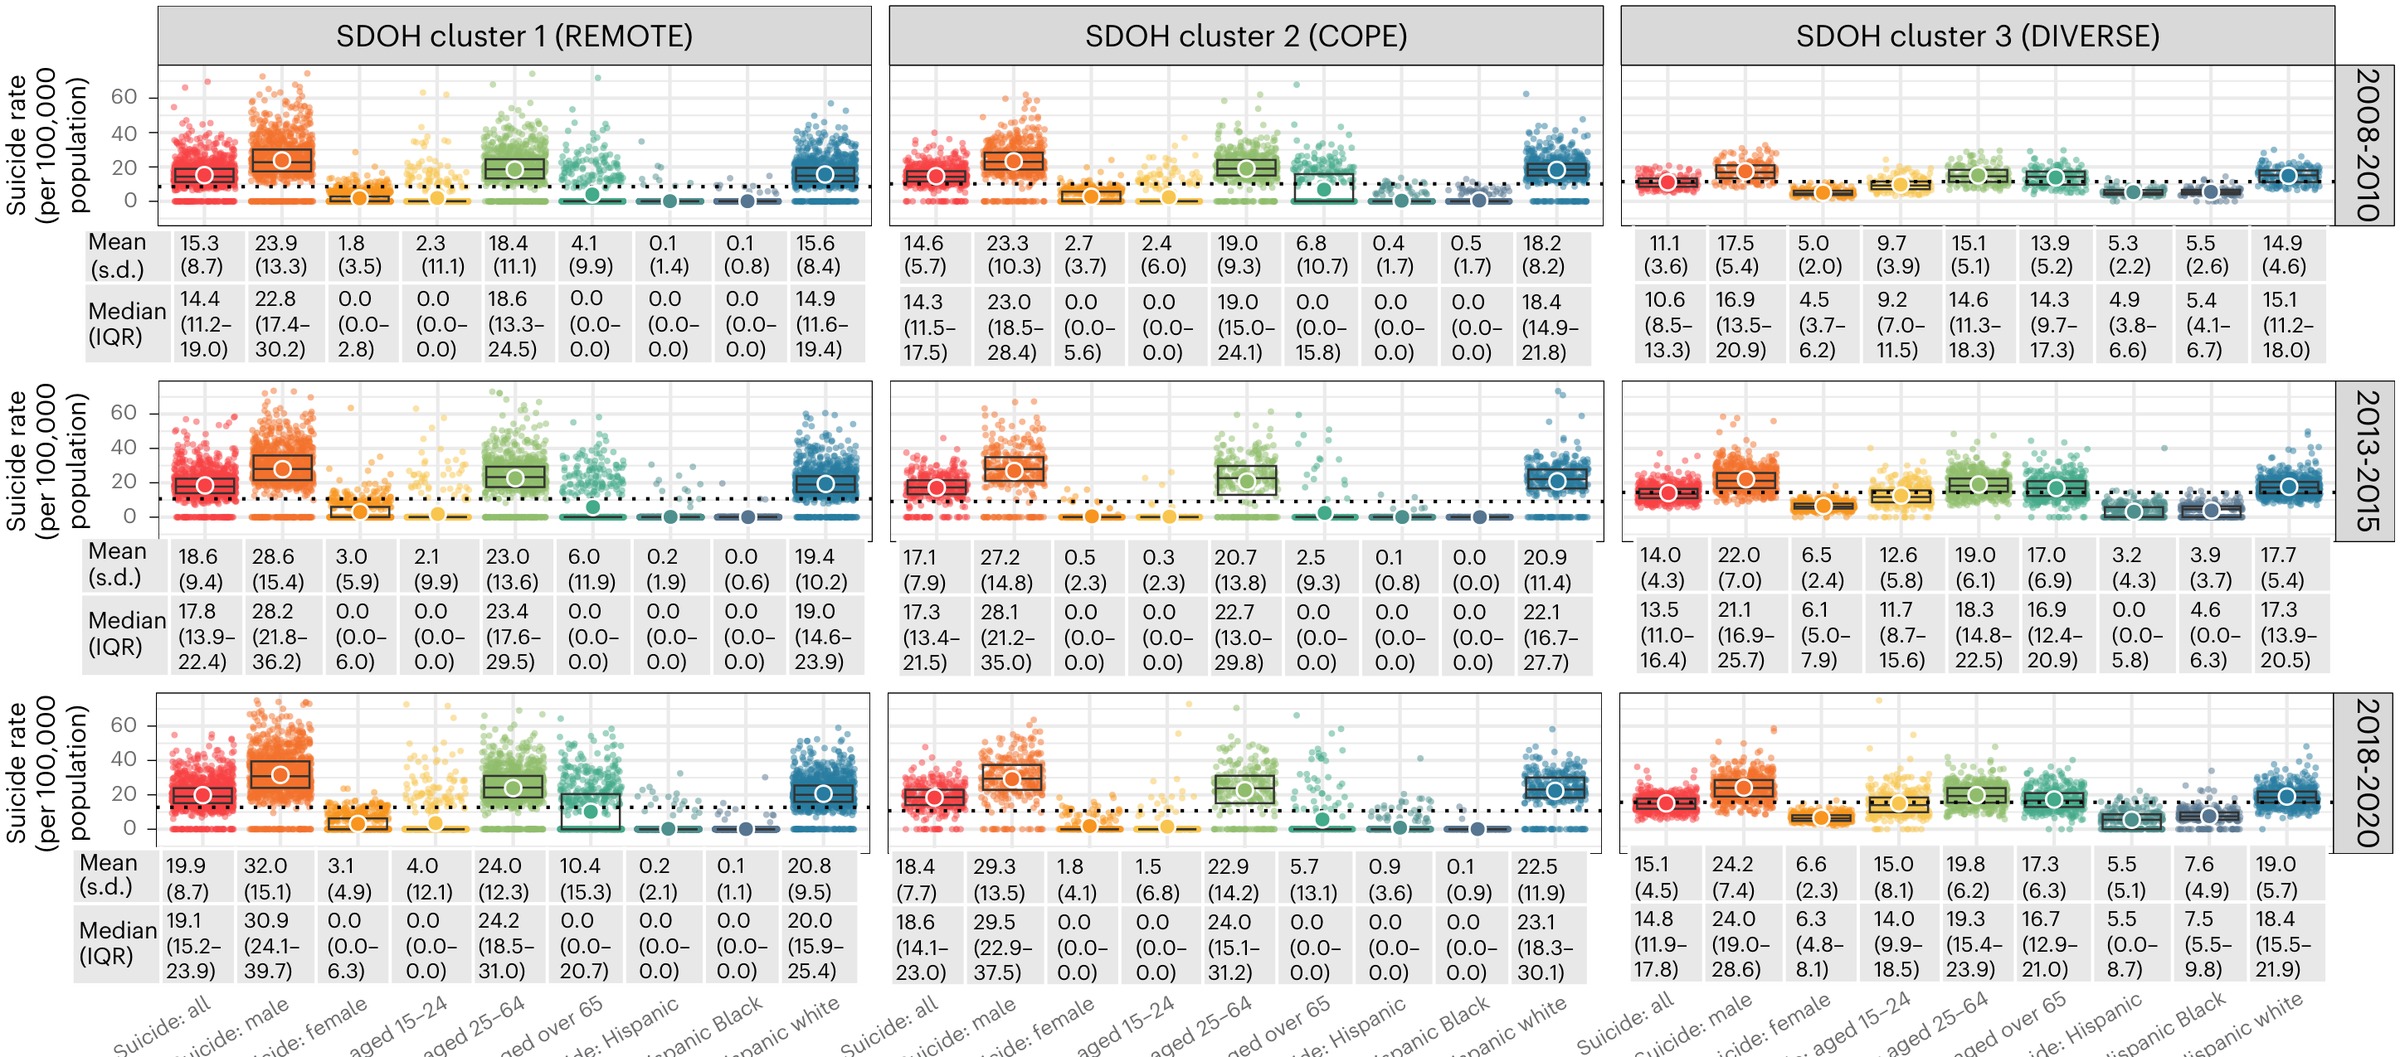
Negative binomial regression related the clusters to suicide rates. REMOTE counties showed higher overall rates, particularly among men. COPE counties showed elevated rates among white populations. DIVERSE counties showed increased rates among women and among Black and Hispanic populations. The distribution of suicide rates across states tracked the distribution of clusters within those states. A one-dimensional deprivation index cannot produce this result, because the three types are not ordered on a single axis: each is disadvantaged in a different way, and each concentrates risk in a different population.
Continuity
Where this leads
This is where the research program moves from measuring places to measuring the people in them. Both studies replace a single exposure measure with a data-driven typology and then estimate disparities within it rather than an average across it, and that design is what the cognitive health work inherits. The county clusters are built from the same class of social and environmental variables that the sensing work produces at far finer resolution, which is the route to estimating a social determinant typology below the county level, where the exposure a person actually experiences is defined.
Summary
Selected papers
2025 Xiao, Y., Meng, Y., Brown, T. T., Keyes, K. M., & Mann, J. J. Addictive screen use trajectories and suicidal behaviors, suicidal ideation, and mental health in US youths. JAMA.co-first
Increasing and high addictive use trajectories carry risk ratios of 2.14 and 2.39 for suicidal behaviors, while baseline total screen time on its own carries none.
2025 Xiao, Y., Meng, Y., Brown, T. T., Tsai, A. C., Snowden, L. R., Chow, J. C.-C., Pathak, J., & Mann, J. J. Machine learning to investigate policy-relevant social determinants of health and suicide rates in the United States. Nature Mental Health, 1–10.co-first
Three county types recovered from 284 social determinant variables across 3,018 counties concentrate suicide risk in different populations: men in REMOTE, white residents in COPE, women and Black and Hispanic residents in DIVERSE.